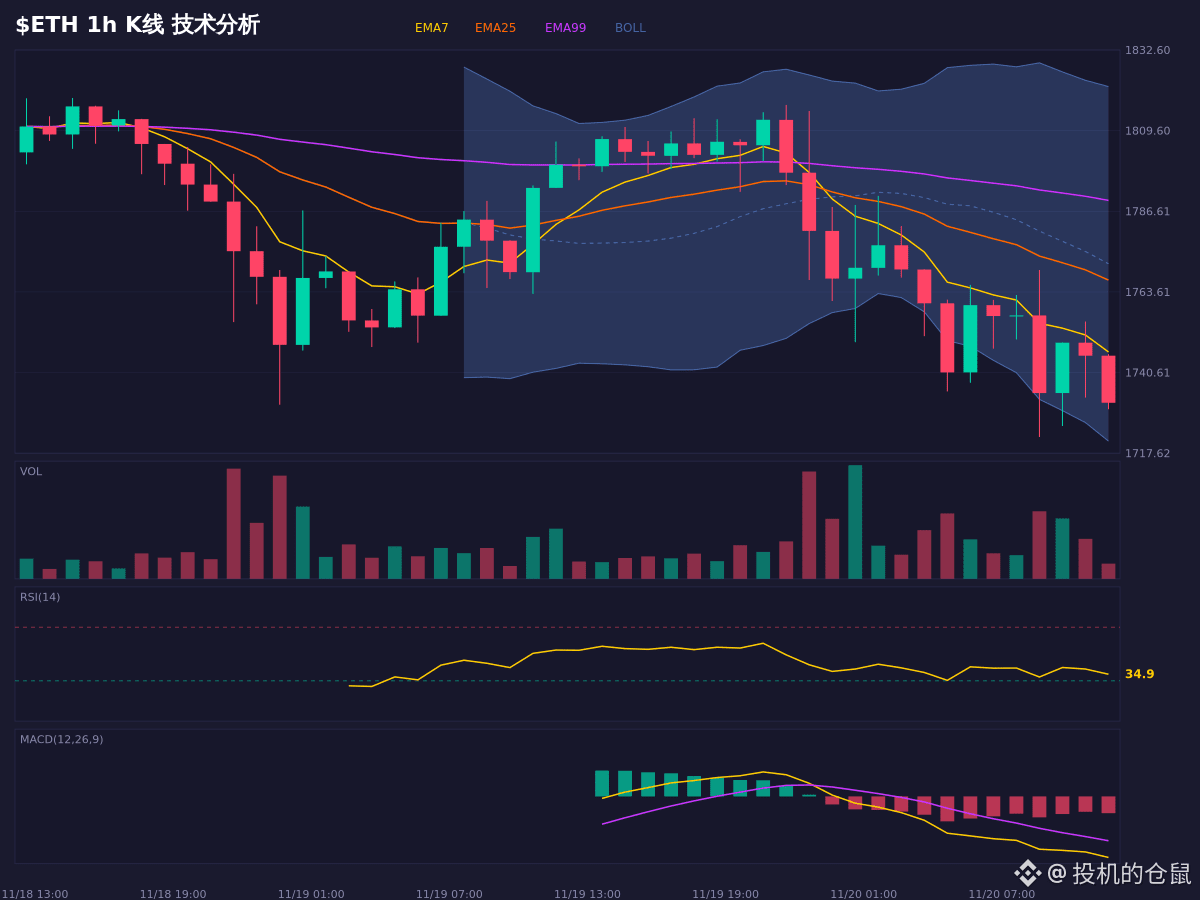
$ETH This price action is technically quite interesting. The moving averages are clearly arranged in a bearish formation: EMA7(1746.42), EMA25(1766.81), and EMA99(1787.21) are aligned in descending order, with the price below all of them. This is a typical weak structure.
However, the long/short ratio shows that 64.6% of positions are long, and the funding rate is also bullish, creating a clear contradiction with the technical picture. Some traders are still daring to go long during this decline—either they’re genuinely confident or they’re underwater and unwilling to cut their losses. The RSI is currently around 35, in a weak zone, but it’s not oversold, so there’s still room to fall.
The key level to watch is EMA7 at 1746.42. If the price can hold above it, the bearish structure may start to ease. If it breaks below the lower Bollinger Band at 1721.01, the weakness will intensify. OBV indicates that funds are flowing out, yet there are so many long positions. Is the major player baiting bulls, or do they have another move in store?
For market observation and conditional analysis only; this does not constitute a record of trading activity.
$ETH #牛市 #现货 #Perpetual Contracts
However, the long/short ratio shows that 64.6% of positions are long, and the funding rate is also bullish, creating a clear contradiction with the technical picture. Some traders are still daring to go long during this decline—either they’re genuinely confident or they’re underwater and unwilling to cut their losses. The RSI is currently around 35, in a weak zone, but it’s not oversold, so there’s still room to fall.
The key level to watch is EMA7 at 1746.42. If the price can hold above it, the bearish structure may start to ease. If it breaks below the lower Bollinger Band at 1721.01, the weakness will intensify. OBV indicates that funds are flowing out, yet there are so many long positions. Is the major player baiting bulls, or do they have another move in store?
For market observation and conditional analysis only; this does not constitute a record of trading activity.
$ETH #牛市 #现货 #Perpetual Contracts