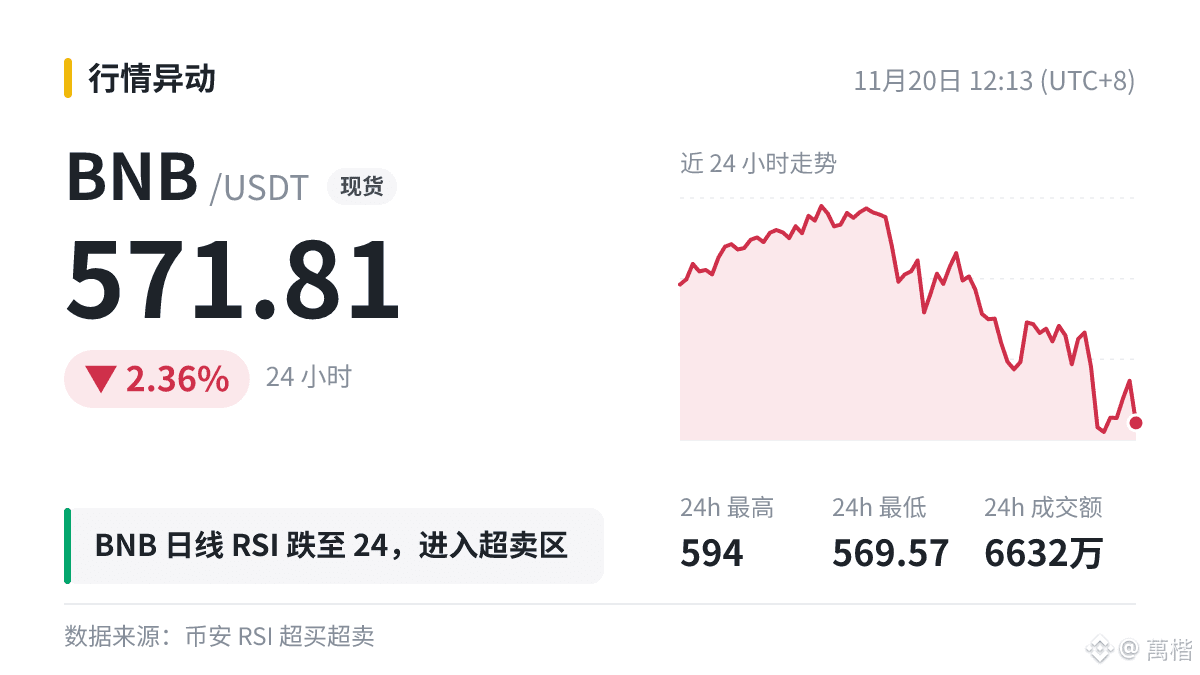
💡 $BNB daily RSI dropped to 24.5🥶
Don't rush—understand RSI before taking action👇
The 14 in RSI refers to 14 candlesticks: on a 4-hour chart, that corresponds to a little over two days (56 hours), and on a daily chart, it's a full two weeks.
Many people pay more attention to the moment RSI leaves the overbought or oversold zone, such as dropping back below 70 from above 70, rather than trading against the trend as soon as it enters the range.
Keep more margin in contract positions; don't let a sudden sharp move wipe out your trade.
Not investment advice in any form. Profit and loss are at your own risk.
Don't rush—understand RSI before taking action👇
The 14 in RSI refers to 14 candlesticks: on a 4-hour chart, that corresponds to a little over two days (56 hours), and on a daily chart, it's a full two weeks.
Many people pay more attention to the moment RSI leaves the overbought or oversold zone, such as dropping back below 70 from above 70, rather than trading against the trend as soon as it enters the range.
Keep more margin in contract positions; don't let a sudden sharp move wipe out your trade.
Not investment advice in any form. Profit and loss are at your own risk.