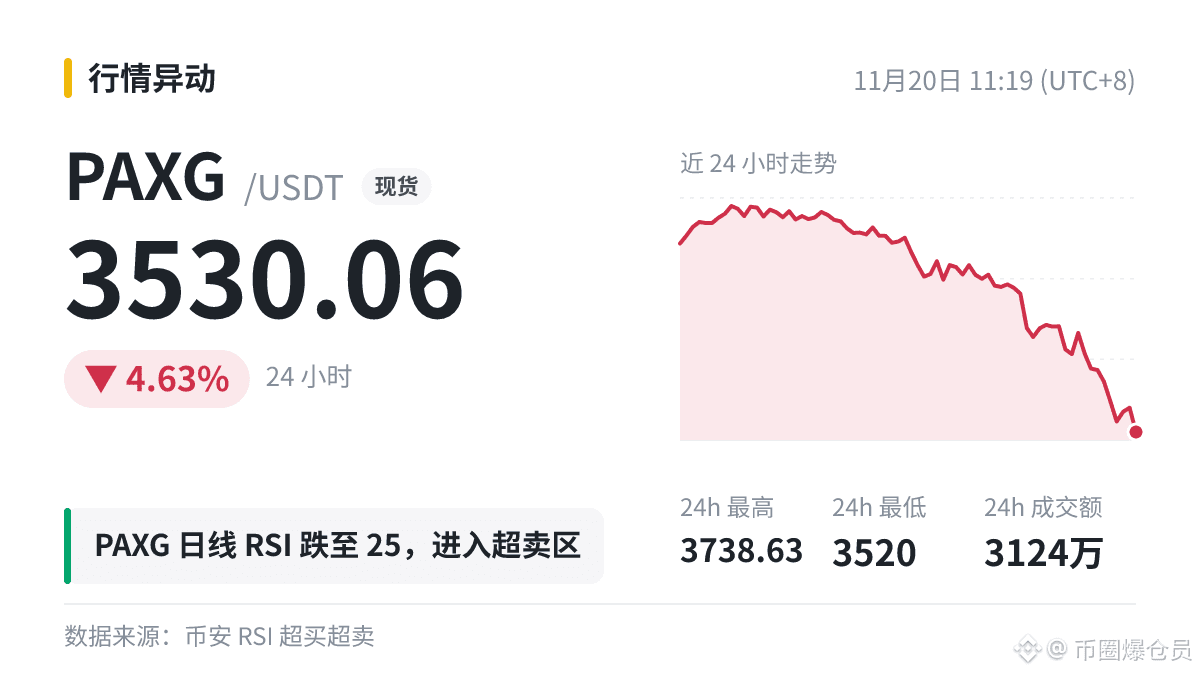
Technical note | $PAXG | Daily RSI(14) 24.9 | Oversold
First, the definition: In traditional usage, an RSI above 70 is considered overbought, while a drop below 30 is considered oversold. Some traders also use 80 / 20 as more extreme thresholds.
A common interpretation: Extreme readings on the daily chart generally carry more weight than those on shorter timeframes. Signals on shorter timeframes occur more frequently and are also noisier.
All data summarize market movements that have already happened; prices can turn in the opposite direction at any time.
Just my personal opinion—take it for what it’s worth. This is not advice.
First, the definition: In traditional usage, an RSI above 70 is considered overbought, while a drop below 30 is considered oversold. Some traders also use 80 / 20 as more extreme thresholds.
A common interpretation: Extreme readings on the daily chart generally carry more weight than those on shorter timeframes. Signals on shorter timeframes occur more frequently and are also noisier.
All data summarize market movements that have already happened; prices can turn in the opposite direction at any time.
Just my personal opinion—take it for what it’s worth. This is not advice.