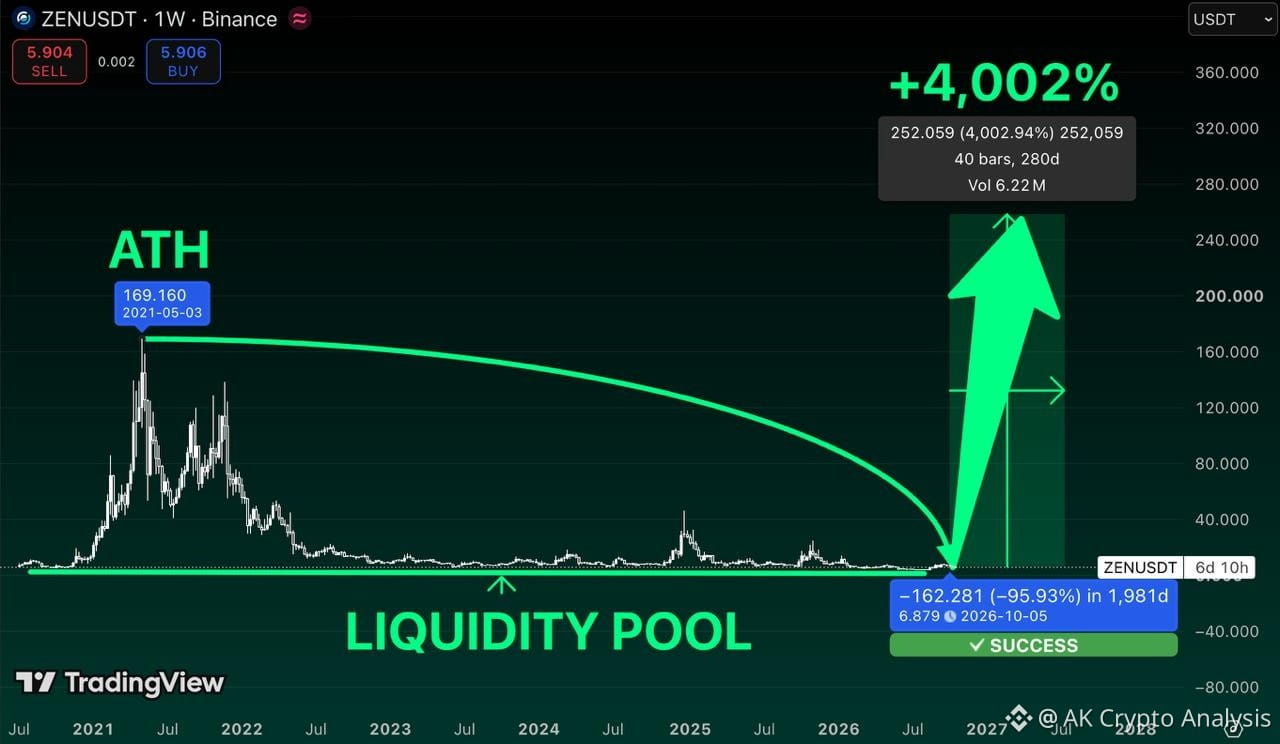
$ZEN LOST 96% OF ITS VALUE. NOW LOOK AT WHAT COULD COME NEXT.
Back in 2021, ZEN was trading above $169.
Today? Around $6.
Five years of brutal selling, failed recoveries, and traders completely losing interest.
But here's why I'm paying attention.
The weekly chart shows price approaching a long-term liquidity zone that has held through multiple market cycles.
If buyers regain control, the upside could be massive.
My aggressive target: $258.
That's a potential +4,002% from the marked low.
Crazy? Absolutely.
But the biggest rallies often begin when nobody believes a recovery is possible.
I'm watching $ZEN closely. A confirmed reversal would make this setup much more interesting.
Would you risk buying a coin that's already down 96%?
#NvidiaBoardReportedlySplitOverHuang’sReturn
$ZEN
Back in 2021, ZEN was trading above $169.
Today? Around $6.
Five years of brutal selling, failed recoveries, and traders completely losing interest.
But here's why I'm paying attention.
The weekly chart shows price approaching a long-term liquidity zone that has held through multiple market cycles.
If buyers regain control, the upside could be massive.
My aggressive target: $258.
That's a potential +4,002% from the marked low.
Crazy? Absolutely.
But the biggest rallies often begin when nobody believes a recovery is possible.
I'm watching $ZEN closely. A confirmed reversal would make this setup much more interesting.
Would you risk buying a coin that's already down 96%?
#NvidiaBoardReportedlySplitOverHuang’sReturn
$ZEN