$WIN Technical Analysis: l gains strength and rises more than 10%!
The WIN/USDT pair has seen a strong upward move over the past 24 hours, trading at 0.00006311 (+10.78%) and breaking through important resistance levels on the short- and medium-term charts.
Indicator highlights:
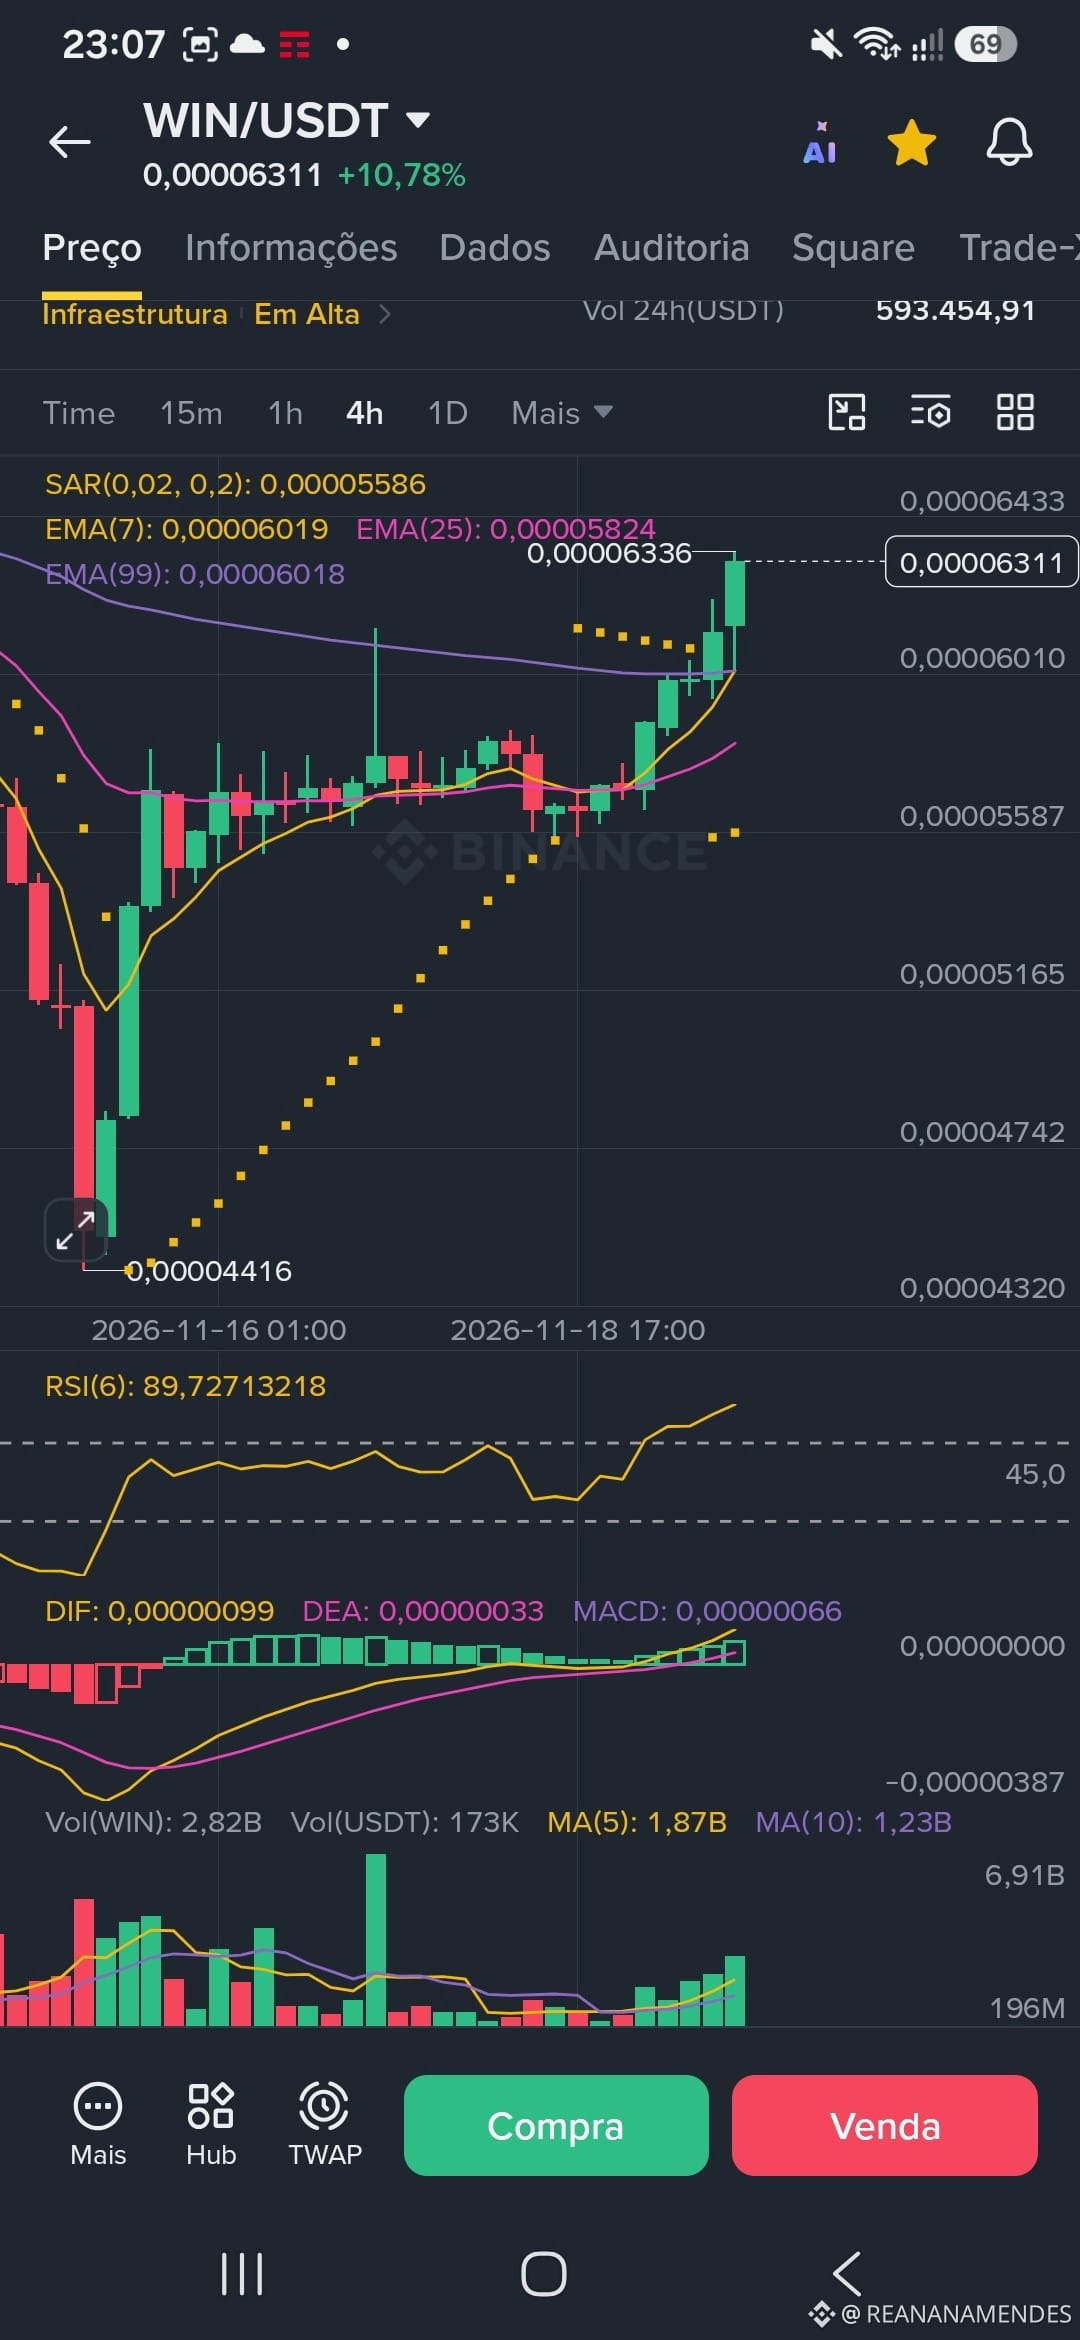
4h chart: Strong bullish candle breaking above the EMA(7) (0.00006019), EMA(25) (0.00005824), and EMA(99) (0.00006018) moving averages. The Parabolic SAR (0.00005586) confirms the uptrend, while the MACD remains positive with rising green bars. Watch the RSI(6) at 89.72, signaling strong overbought conditions on the 4h chart—a reason to be cautious about possible profit-taking.
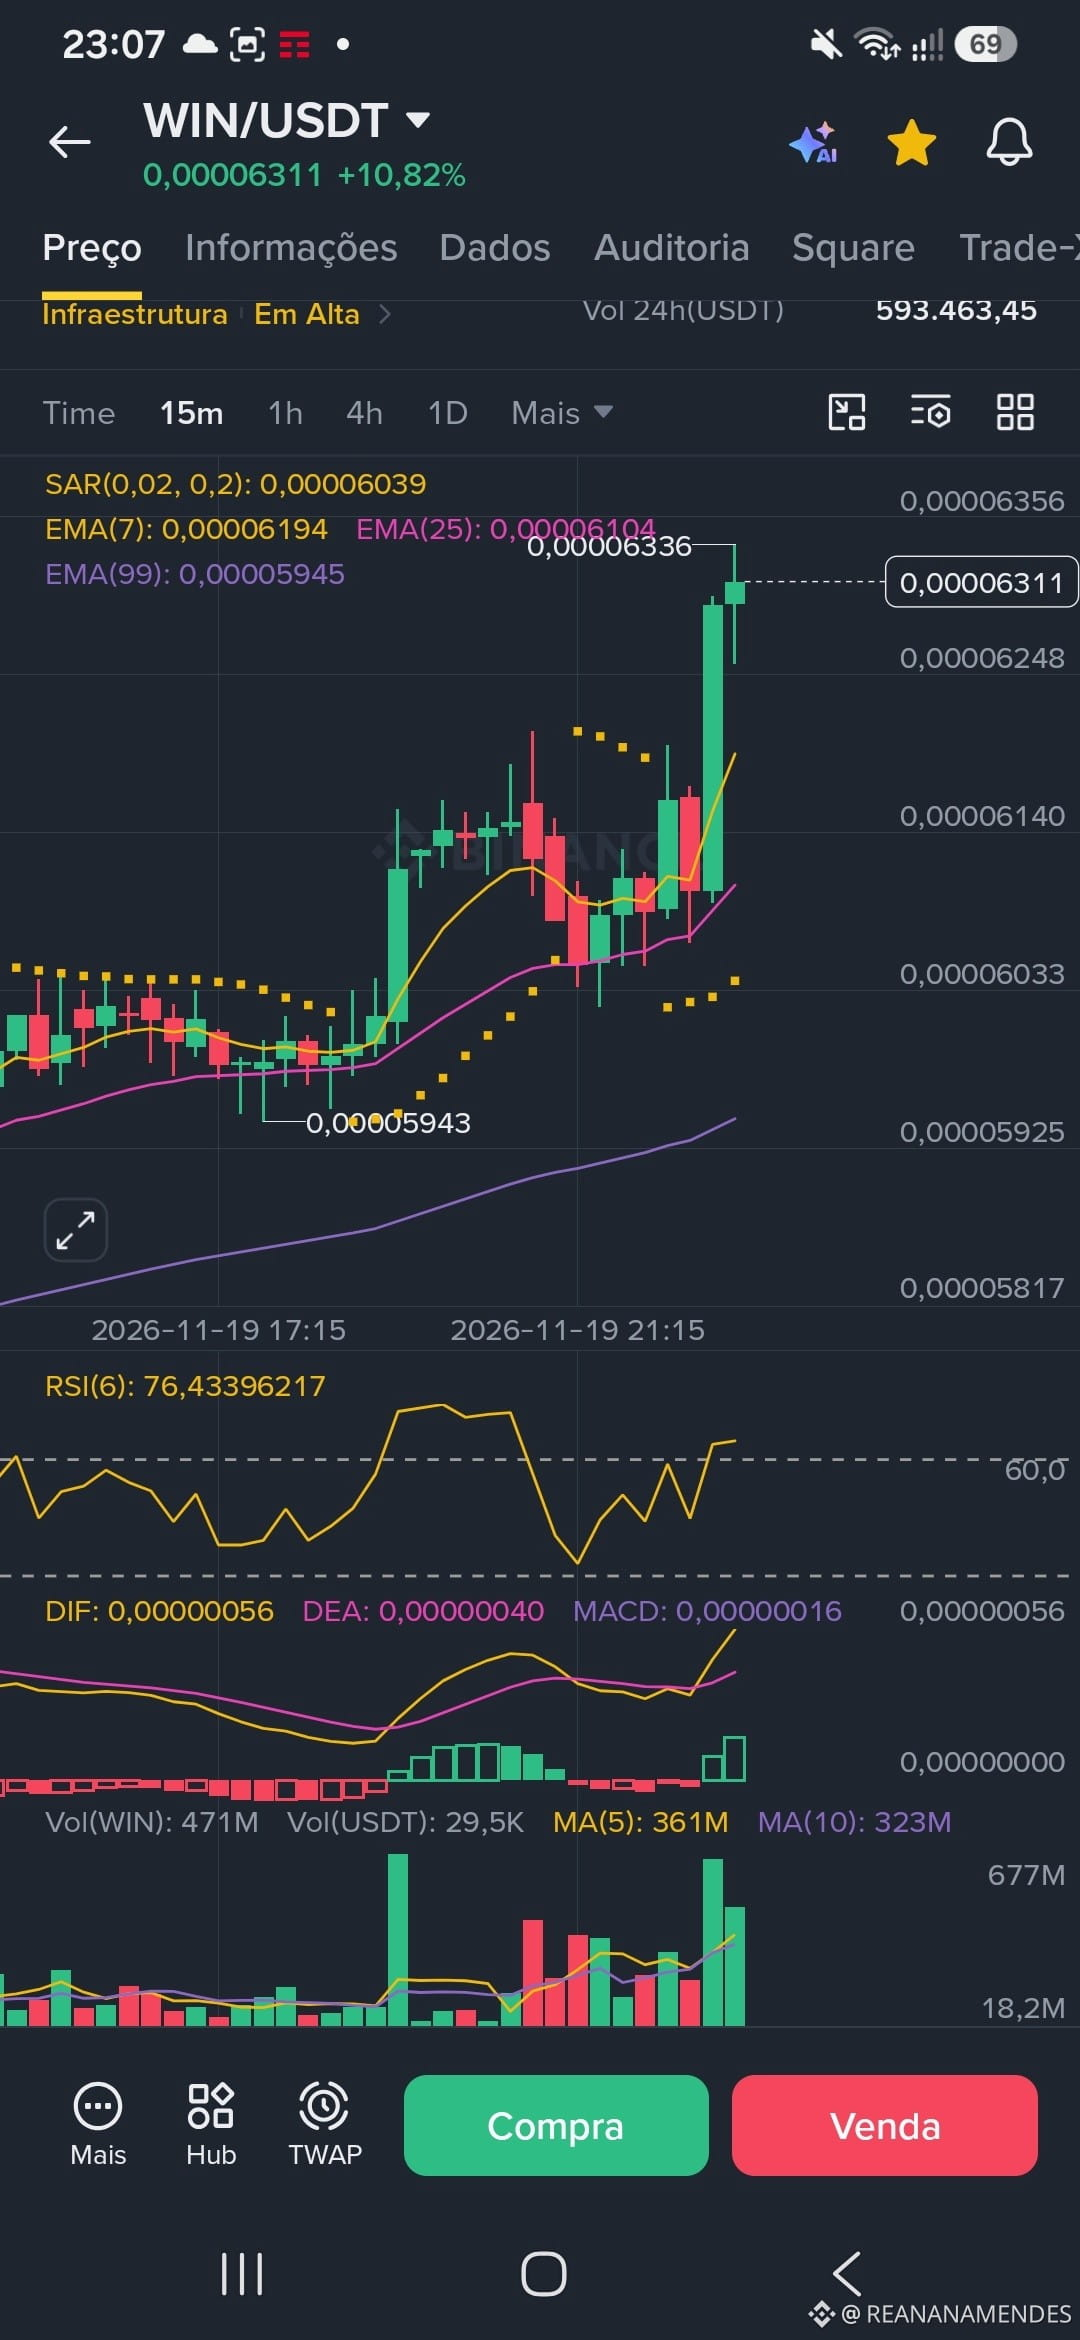
15m chart: The trend is well aligned, with the price above the EMA(7) (0.00006194), EMA(25) (0.00006104), and EMA(99) (0.00005945), testing the recent high at 0.00006336. The RSI(6) at 76.43 shows short-term buying strength, but is already nearing the overbought zone.
Volume: A significant increase in buying volume (593.45 thousand USDT in 24h) is supporting the current breakout.
Watch point: With the RSI stretched on both the 15m and 4h charts, it's worth watching to see whether the price consolidates above 0.00006100–0.00006190 (former resistance that is now acting as support) before looking for new gains.
Option 2: Short version for X (@reanamendes)
$WIN surging +10.8% to 0.00006311! 📈
Clear breakout above the EMAs (7, 25, and 99) on the 4h and 15m charts, with strong volume inflows.
Watch point: RSI(6) has already hit 89.7 on the 4h chart and 76.4 on the 15m chart—a very stretched area that calls for risk management and keeping an eye on support at 0.00006100.
$WIN #BINANCE
The WIN/USDT pair has seen a strong upward move over the past 24 hours, trading at 0.00006311 (+10.78%) and breaking through important resistance levels on the short- and medium-term charts.
Indicator highlights:
4h chart: Strong bullish candle breaking above the EMA(7) (0.00006019), EMA(25) (0.00005824), and EMA(99) (0.00006018) moving averages. The Parabolic SAR (0.00005586) confirms the uptrend, while the MACD remains positive with rising green bars. Watch the RSI(6) at 89.72, signaling strong overbought conditions on the 4h chart—a reason to be cautious about possible profit-taking.
15m chart: The trend is well aligned, with the price above the EMA(7) (0.00006194), EMA(25) (0.00006104), and EMA(99) (0.00005945), testing the recent high at 0.00006336. The RSI(6) at 76.43 shows short-term buying strength, but is already nearing the overbought zone.
Volume: A significant increase in buying volume (593.45 thousand USDT in 24h) is supporting the current breakout.
Watch point: With the RSI stretched on both the 15m and 4h charts, it's worth watching to see whether the price consolidates above 0.00006100–0.00006190 (former resistance that is now acting as support) before looking for new gains.
Option 2: Short version for X (@reanamendes)
$WIN surging +10.8% to 0.00006311! 📈
Clear breakout above the EMAs (7, 25, and 99) on the 4h and 15m charts, with strong volume inflows.
Watch point: RSI(6) has already hit 89.7 on the 4h chart and 76.4 on the 15m chart—a very stretched area that calls for risk management and keeping an eye on support at 0.00006100.
$WIN #BINANCE