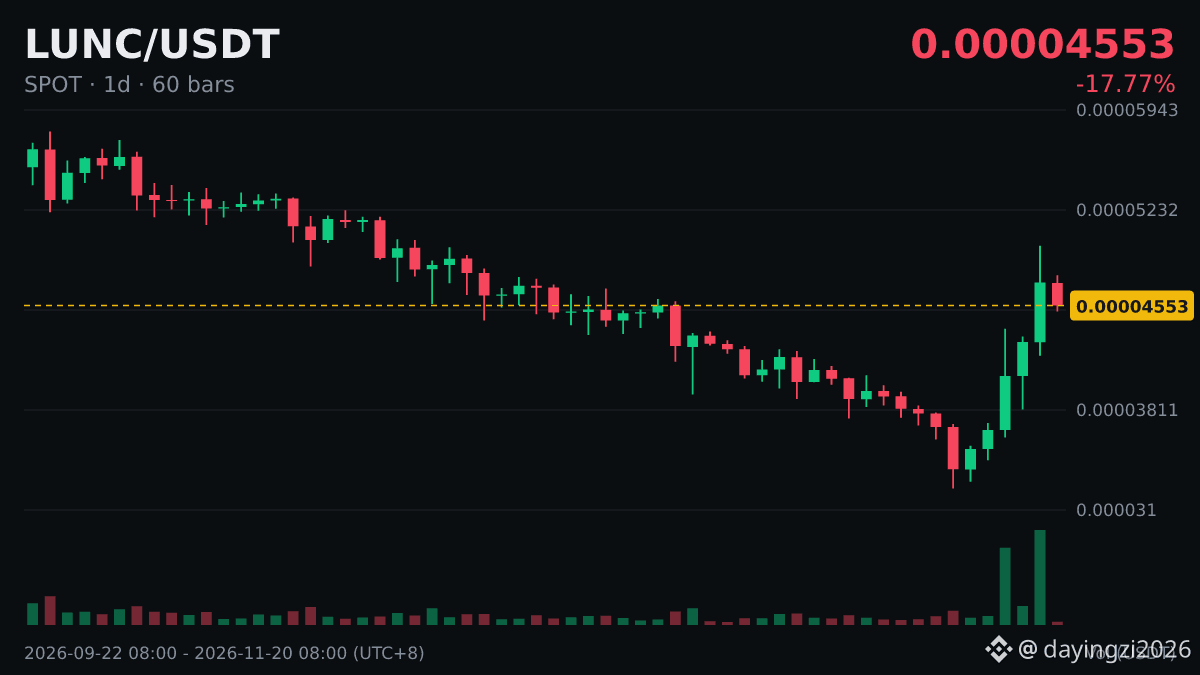
$LUNC |5 consecutive bullish daily candles|cumulative +39.67%
Before looking at position size, first understand consecutive bullish daily candles.
Consecutive K-lines moving in the same direction indicate that buyers or sellers have remained dominant over these days, making this a stretch with a fairly consistent direction on the chart.
A single K-line in the opposite direction after a run of bullish or bearish candles does not mean the trend has reversed; in many cases, it is just a one-day breather.
The same reading can mean very different things in different market conditions, so don't blindly apply a rule of thumb.
Before looking at position size, first understand consecutive bullish daily candles.
Consecutive K-lines moving in the same direction indicate that buyers or sellers have remained dominant over these days, making this a stretch with a fairly consistent direction on the chart.
A single K-line in the opposite direction after a run of bullish or bearish candles does not mean the trend has reversed; in many cases, it is just a one-day breather.
The same reading can mean very different things in different market conditions, so don't blindly apply a rule of thumb.