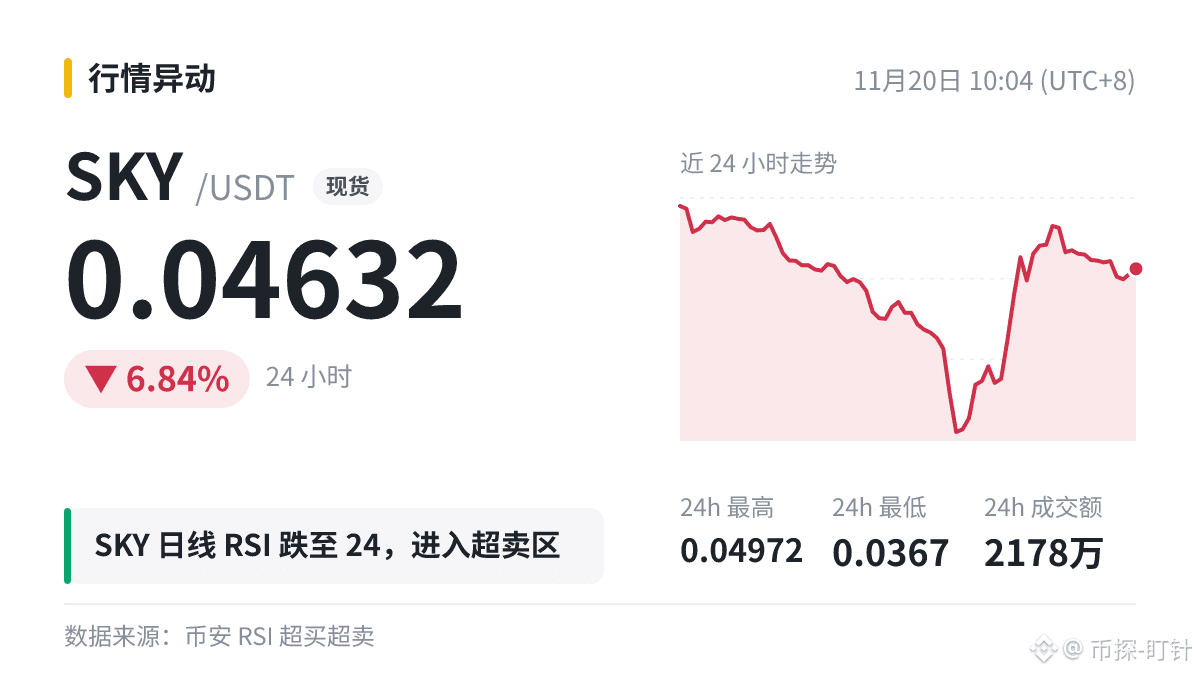
🧭 Quick data overview: $SKY |Daily RSI(14) 24.5|Oversold
· Definition: RSI 50 is often treated as the dividing line between strength and weakness: staying above 50 indicates that upward momentum is prevailing; below it, the opposite is true.
· How to read it: “Divergence” is a commonly discussed RSI signal: when the price makes a new high but RSI doesn’t, it is often seen as a sign that upward momentum is weakening. However, divergence can persist over multiple instances.
Indicators can be inaccurate, so risk management is essential: thinking ahead about what to do if you’re wrong is more important than whether your prediction is right.
#SKY
· Definition: RSI 50 is often treated as the dividing line between strength and weakness: staying above 50 indicates that upward momentum is prevailing; below it, the opposite is true.
· How to read it: “Divergence” is a commonly discussed RSI signal: when the price makes a new high but RSI doesn’t, it is often seen as a sign that upward momentum is weakening. However, divergence can persist over multiple instances.
Indicators can be inaccurate, so risk management is essential: thinking ahead about what to do if you’re wrong is more important than whether your prediction is right.
#SKY