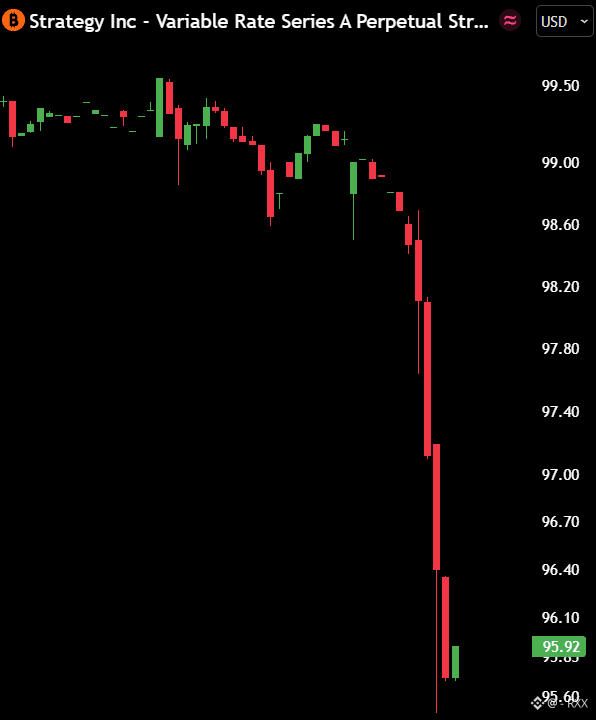
🕵️ STRC broke $96. Who blinked first?
On Nov. 18, Ash Crypto flagged Strategy’s STRC preferred shares trading below $96, near a three-month low. Put that screenshot beside a red Bitcoin candle and you can make the two moves look connected. The timestamps make for a better story.
🔎 Start before the U.S. bell
Open $BTC and mark its overnight high and low. Was Bitcoin already under pressure before STRC’s regular trading session opened?
If BTC broke its overnight low first and STRC opened below its previous close, the stock’s opening move came after Bitcoin had already weakened.
If Bitcoin held its range until STRC crossed $96, you have a different sequence to investigate.
Use the same timezone on both charts. A clean comparison starts with agreeing on which candle came first.
📊 Give Bitcoin two comparisons
Open ETH and $BNB and anchor both charts to the start of the same U.S. session. Check their percentage moves when STRC crossed $96. Did all three crypto charts break local lows around the same time? Did BTC move while ETH held their ranges?
Or did the alts lead while STRC was still above the level?
If everything moved together, look for the first chart that stopped following the others. One coin holding a higher low while the rest keep sliding is worth a second look.
🔁 Replay the recovery
Now look at the last hour of the equity session. Did STRC close back above $96? Where did BTC finish relative to its price before the break? If one recovered and the other stayed weak, write down when their paths split. $EVAA
For a better comparison, repeat the exercise on two earlier sessions when STRC traded weakly. Use the same timeframe and opening window. Include a session where Bitcoin held up into the close. That gives you something to compare with Nov. 18 beyond two charts that happened to be red.
You can do the whole replay with four notes: STRC’s break time, BTC’s first local low, the last hour’s recovery and whether ETH and BNB moved with BTC. If the first two timestamps are close, zoom in only if the chart data supports it.
#Strategy
On Nov. 18, Ash Crypto flagged Strategy’s STRC preferred shares trading below $96, near a three-month low. Put that screenshot beside a red Bitcoin candle and you can make the two moves look connected. The timestamps make for a better story.
🔎 Start before the U.S. bell
Open $BTC and mark its overnight high and low. Was Bitcoin already under pressure before STRC’s regular trading session opened?
If BTC broke its overnight low first and STRC opened below its previous close, the stock’s opening move came after Bitcoin had already weakened.
If Bitcoin held its range until STRC crossed $96, you have a different sequence to investigate.
Use the same timezone on both charts. A clean comparison starts with agreeing on which candle came first.
📊 Give Bitcoin two comparisons
Open ETH and $BNB and anchor both charts to the start of the same U.S. session. Check their percentage moves when STRC crossed $96. Did all three crypto charts break local lows around the same time? Did BTC move while ETH held their ranges?
Or did the alts lead while STRC was still above the level?
If everything moved together, look for the first chart that stopped following the others. One coin holding a higher low while the rest keep sliding is worth a second look.
🔁 Replay the recovery
Now look at the last hour of the equity session. Did STRC close back above $96? Where did BTC finish relative to its price before the break? If one recovered and the other stayed weak, write down when their paths split. $EVAA
For a better comparison, repeat the exercise on two earlier sessions when STRC traded weakly. Use the same timeframe and opening window. Include a session where Bitcoin held up into the close. That gives you something to compare with Nov. 18 beyond two charts that happened to be red.
You can do the whole replay with four notes: STRC’s break time, BTC’s first local low, the last hour’s recovery and whether ETH and BNB moved with BTC. If the first two timestamps are close, zoom in only if the chart data supports it.
#Strategy