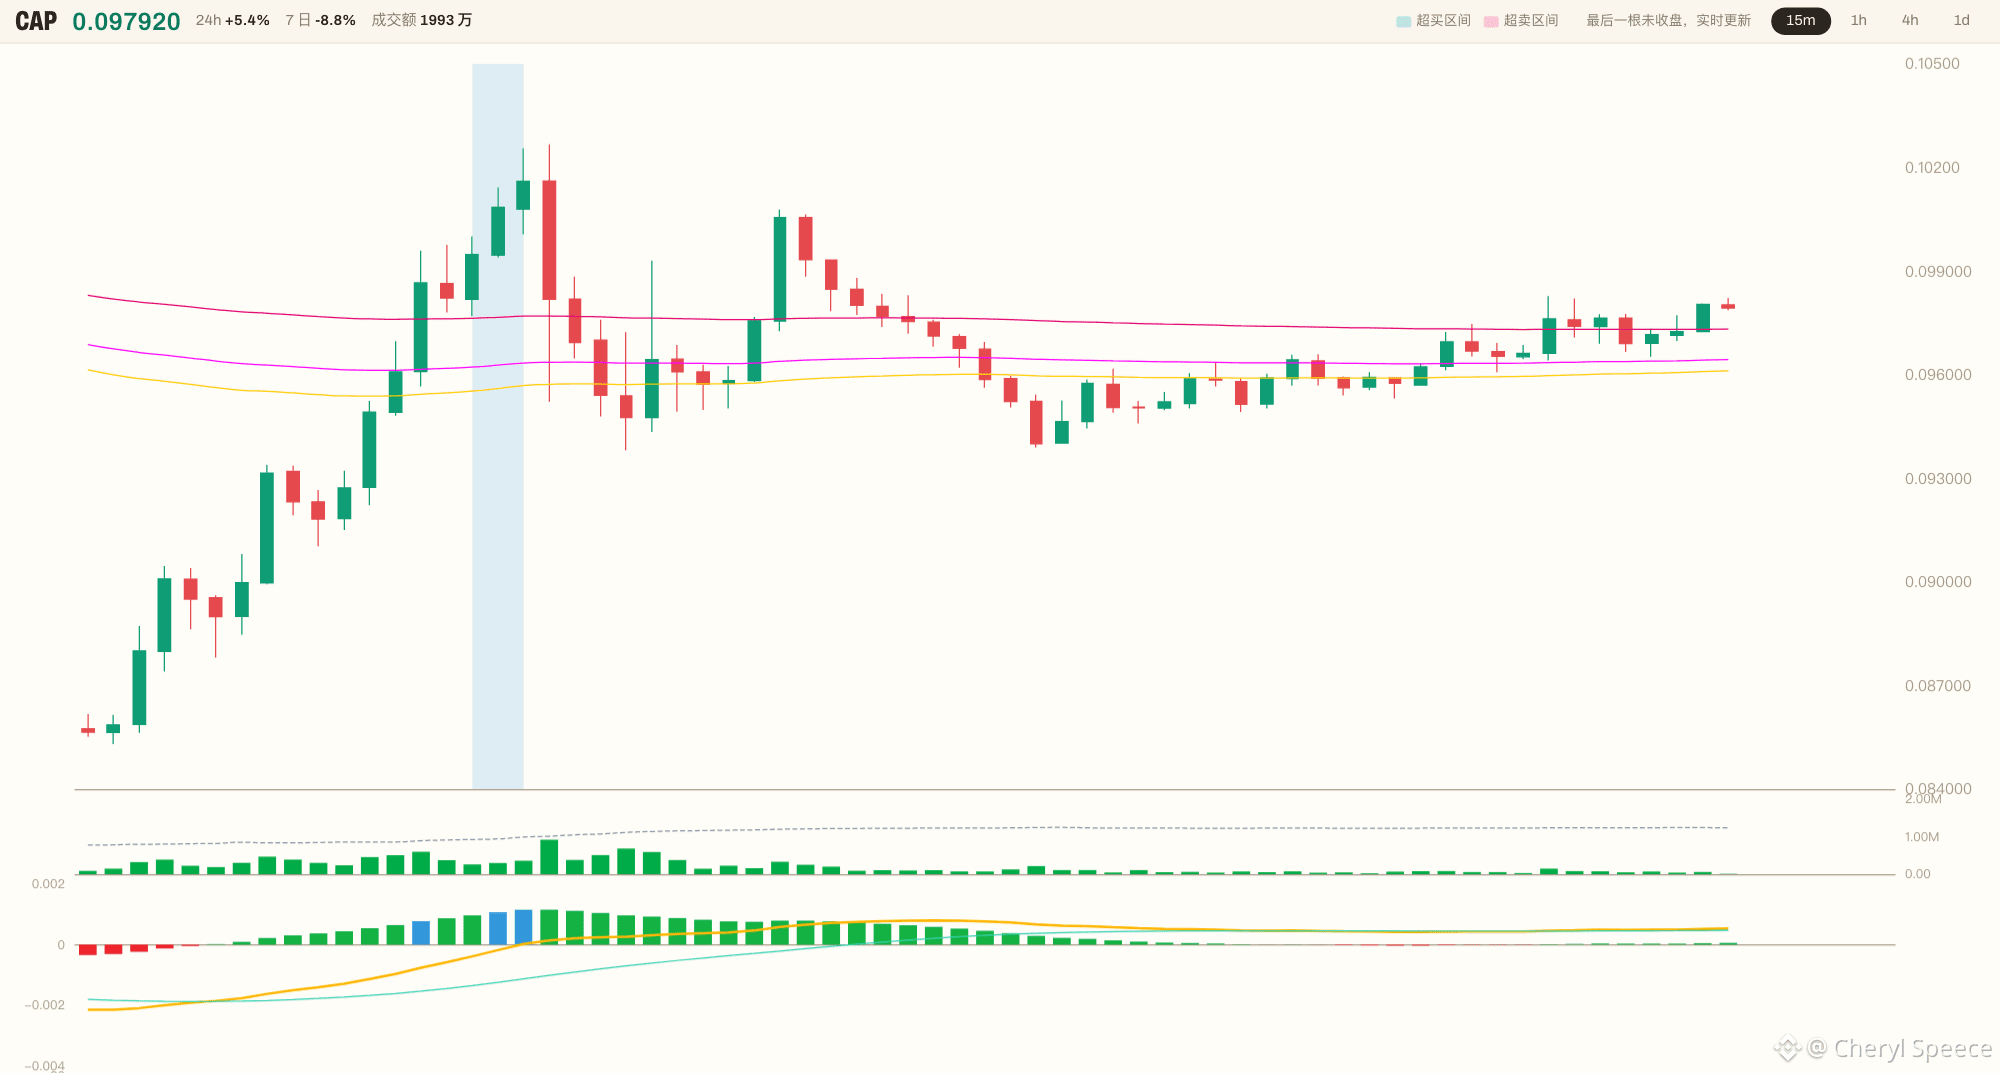
😤 0.098040—first, let’s slap this closing price on the table. $CAP 15m clawed its way up out of a pile of shorts, clearing the previous 48-candle high at 0.1000 in one move and closing above the cluster, up +0.72%.
🔥 The entire 24-hour setup was bearish, then suddenly it gave you a kick like a floor-shattering thud.
😑 I went through the checklist: all seven boxes lit up—volume 2.05x, closing position 72%, RSI 72.7, CCI 108, and only +3.23% away from the cluster.
💢 But the 1h moving averages are tangled in a mess, with no multi-timeframe confluence at all. BTC and ETH are both leaning bearish, so I’m not allowing any altcoin longs.
This isn’t a trend-following long; it’s a reversal test emerging within a prolonged downtrend.
The dividing line isn’t 0.098040—it’s the cluster’s upper edge down at 0.097336.
I’m not entering a trade. I’ll wait: price must retest without falling back below that line, and the 1h chart must stabilize before we talk about going long. Jumping in now means catching the pullback after the spike.
💬 What do you think: all seven boxes lit up, the previous high taken out amid a pile of shorts, but the 1h chart still tangled up—is this the bears really letting go, or a trap set for the retest?
#ETH #BTC $ETH $BTC
🔥 The entire 24-hour setup was bearish, then suddenly it gave you a kick like a floor-shattering thud.
😑 I went through the checklist: all seven boxes lit up—volume 2.05x, closing position 72%, RSI 72.7, CCI 108, and only +3.23% away from the cluster.
💢 But the 1h moving averages are tangled in a mess, with no multi-timeframe confluence at all. BTC and ETH are both leaning bearish, so I’m not allowing any altcoin longs.
This isn’t a trend-following long; it’s a reversal test emerging within a prolonged downtrend.
The dividing line isn’t 0.098040—it’s the cluster’s upper edge down at 0.097336.
I’m not entering a trade. I’ll wait: price must retest without falling back below that line, and the 1h chart must stabilize before we talk about going long. Jumping in now means catching the pullback after the spike.
💬 What do you think: all seven boxes lit up, the previous high taken out amid a pile of shorts, but the 1h chart still tangled up—is this the bears really letting go, or a trap set for the retest?
#ETH #BTC $ETH $BTC