. 🧯 Altcoins sold off. Here’s how to check whether leverage came out too
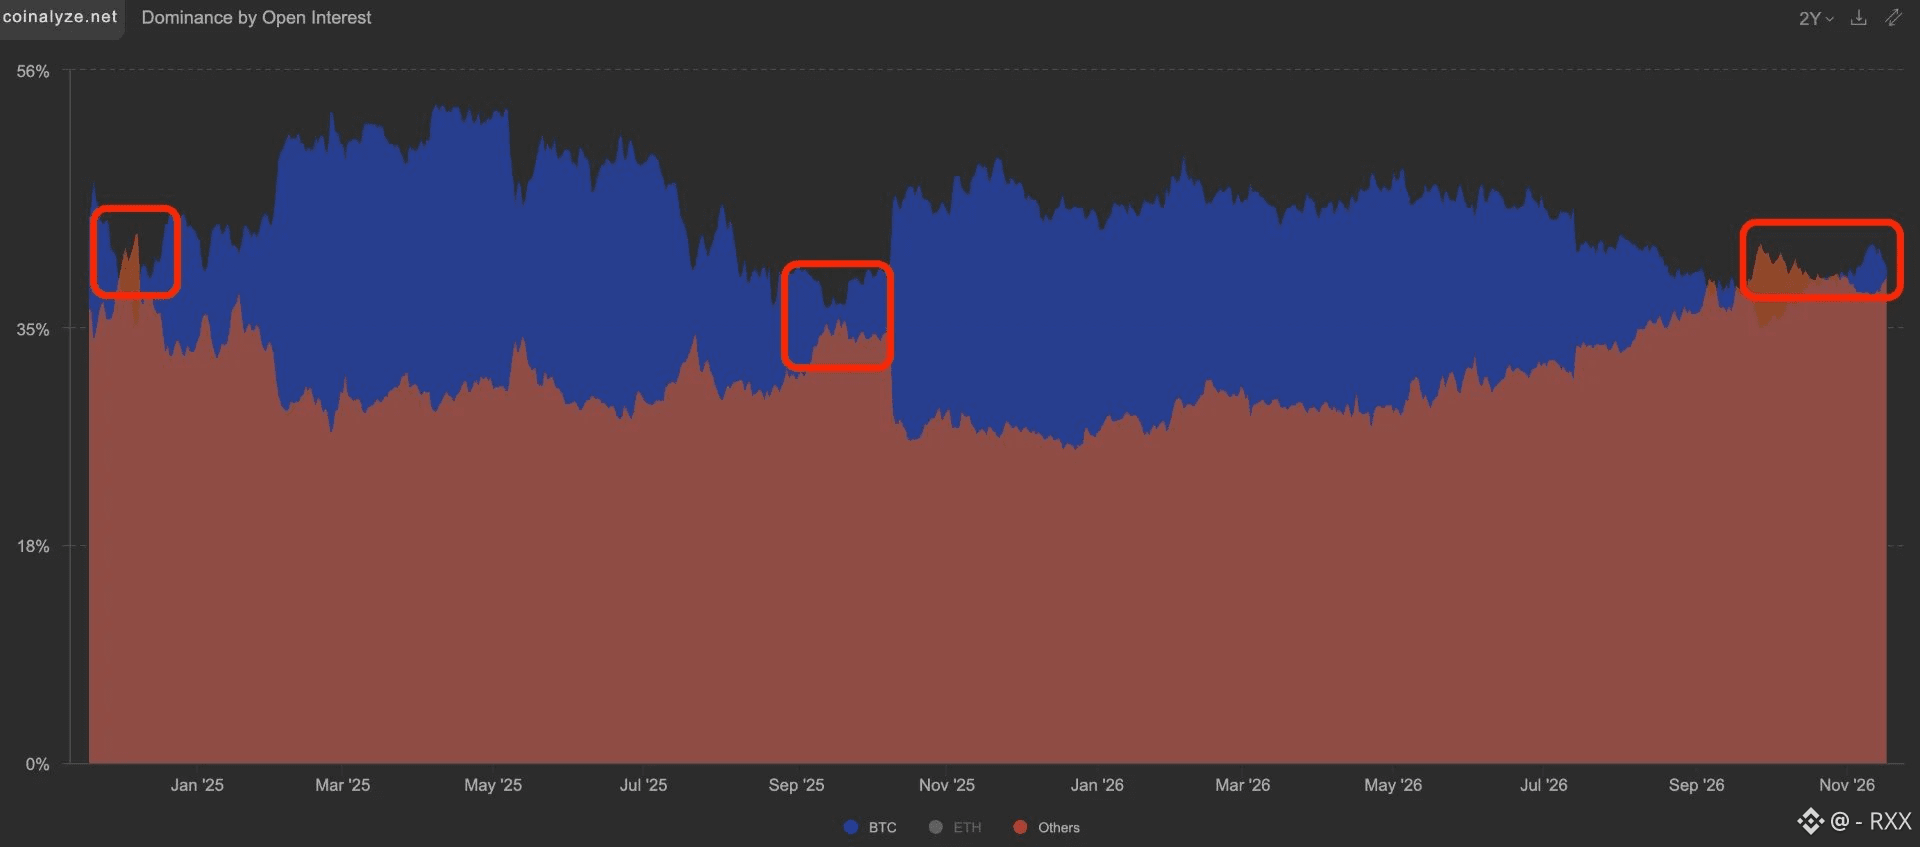
Ash Crypto’s Nov. 19 post highlighted a change in altcoins’ share of open interest from 42% to 39%. That’s a useful starting point, but the share answers a specific question: how much of the tracked total belongs to altcoins? For an individual contract, the question is how many positions are still open and how that figure changed during the sell-off.
Start with SOL and XRP. Open each perpetual contract on the same exchange and use the same timeframe. Mark the point where price broke the previous daily low. Then look at open interest immediately before that break, at the end of the sell-off, and after the first meaningful rebound.
Three patterns are worth looking for.
📉 Price fell and open interest fell with it.
Outstanding positions shrank during the move. Check whether the open interest series is measured in contracts or dollars. When it’s expressed in dollars, a lower token price can pull down the reported value even if the number of open contracts barely changes.
🧱 Price fell while open interest held up or rose. Plenty of exposure stayed open, or new positions came in. The open interest figure counts positions on both sides of a contract. If you’re trying to understand which side was under pressure, bring in funding and liquidation data where available.
🔁 Price rebounded and open interest rebuilt quickly. Compare the rebound with spot volume. I’d pay close attention to a recovery where derivatives positions return quickly and the spot chart struggles to clear the first resistance level. Then check whether price holds that bounce after another session.
Now open $DOGE and $EVAA nd repeat the same steps. Use $BTC as a benchmark for the same dates. If the behavior shows up across all five, it could reflect a broad market move. If one coin stands apart, that’s a reason to take a closer look at its own contract and recent price action.
#OpenInterest #CryptoDerivatives #Altcoin
Ash Crypto’s Nov. 19 post highlighted a change in altcoins’ share of open interest from 42% to 39%. That’s a useful starting point, but the share answers a specific question: how much of the tracked total belongs to altcoins? For an individual contract, the question is how many positions are still open and how that figure changed during the sell-off.
Start with SOL and XRP. Open each perpetual contract on the same exchange and use the same timeframe. Mark the point where price broke the previous daily low. Then look at open interest immediately before that break, at the end of the sell-off, and after the first meaningful rebound.
Three patterns are worth looking for.
📉 Price fell and open interest fell with it.
Outstanding positions shrank during the move. Check whether the open interest series is measured in contracts or dollars. When it’s expressed in dollars, a lower token price can pull down the reported value even if the number of open contracts barely changes.
🧱 Price fell while open interest held up or rose. Plenty of exposure stayed open, or new positions came in. The open interest figure counts positions on both sides of a contract. If you’re trying to understand which side was under pressure, bring in funding and liquidation data where available.
🔁 Price rebounded and open interest rebuilt quickly. Compare the rebound with spot volume. I’d pay close attention to a recovery where derivatives positions return quickly and the spot chart struggles to clear the first resistance level. Then check whether price holds that bounce after another session.
Now open $DOGE and $EVAA nd repeat the same steps. Use $BTC as a benchmark for the same dates. If the behavior shows up across all five, it could reflect a broad market move. If one coin stands apart, that’s a reason to take a closer look at its own contract and recent price action.
#OpenInterest #CryptoDerivatives #Altcoin