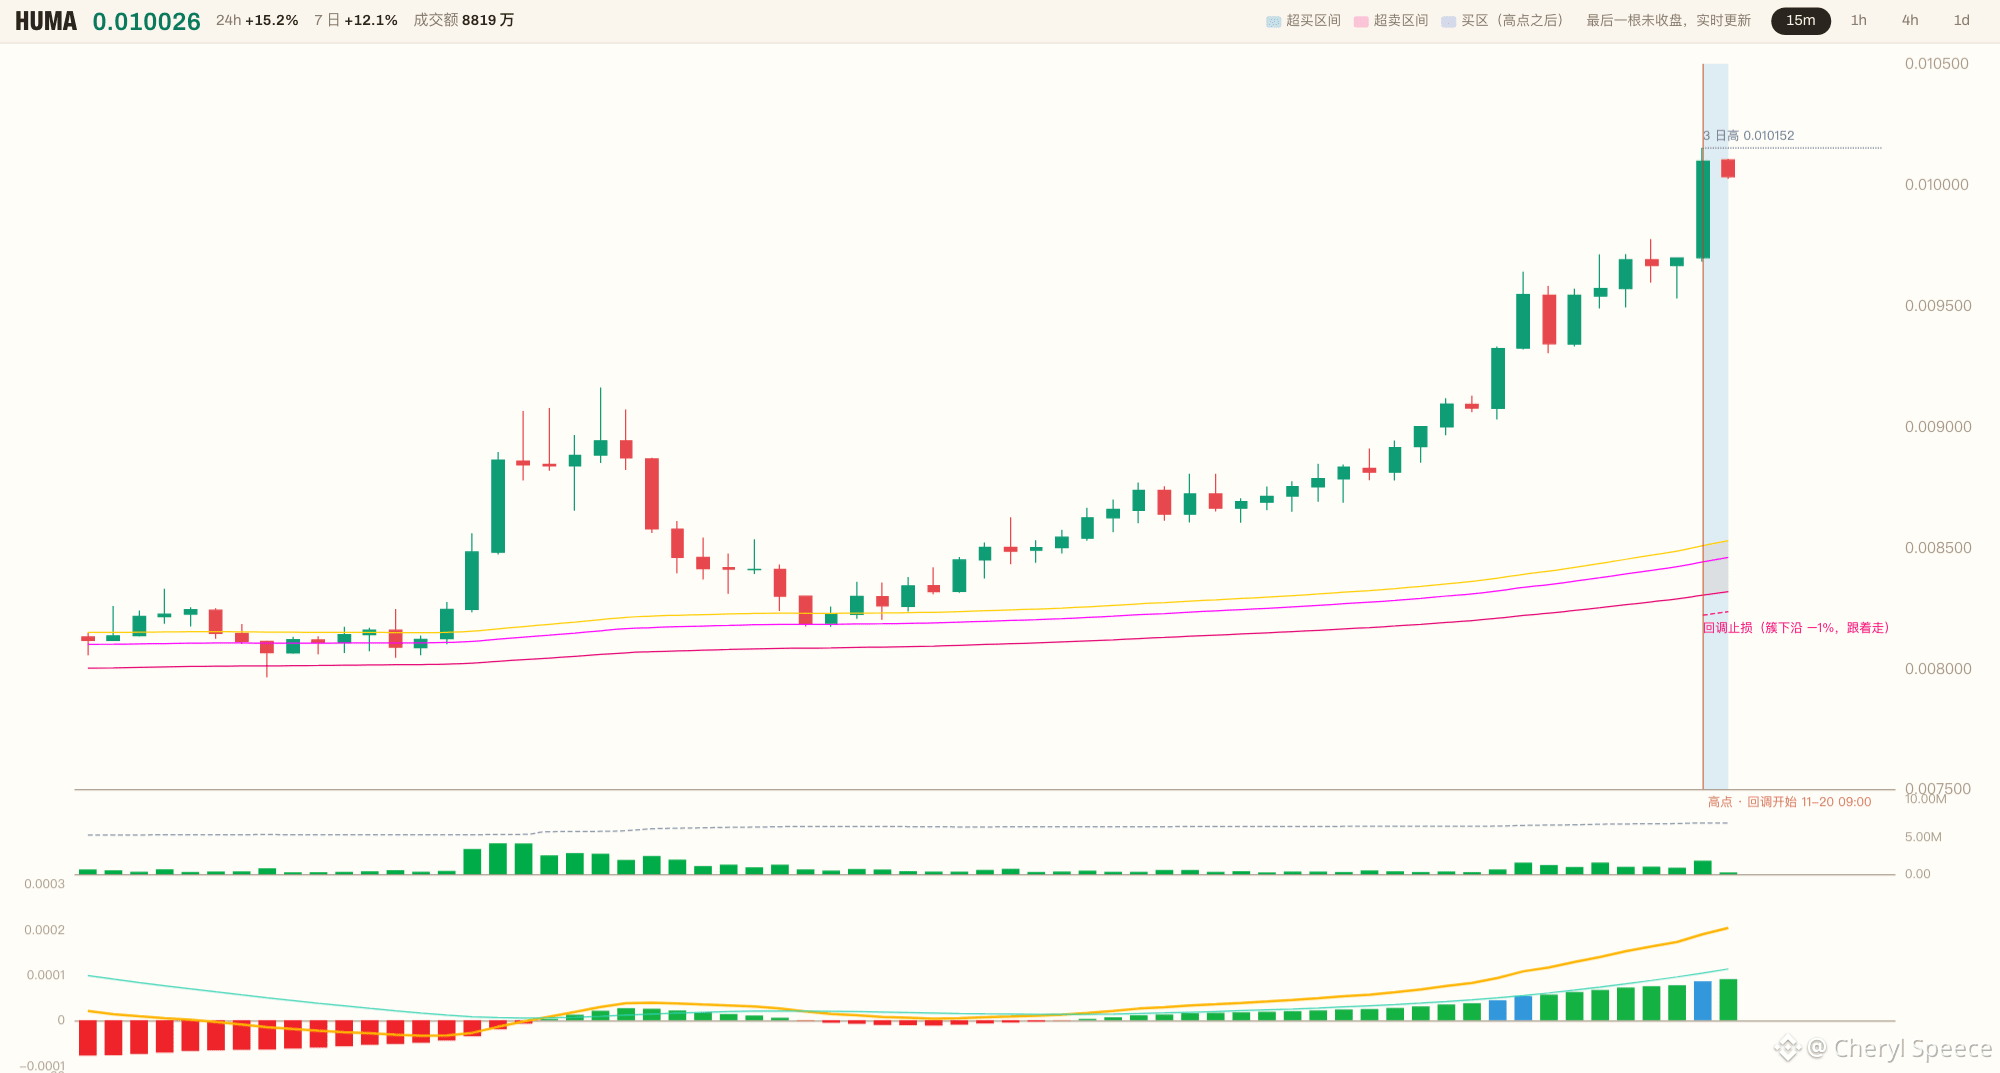
😤 0.010097—first, pin this closing price to the screen. $HUMA 15m Volume surged 2.6x, and one bullish candle punched through the previous 12-hour high of 0.009775.
🔥 It closed at 88% of the candle’s range, right near the top. That was a serious kick.
😑 But after going through my checklist, it’s 4 / 7. All the positives are volume and price action: volume up 2.68x, broke the previous high, closing position, CCI 280.
💢 What stops me is the distance—the price is +18.69% above the moving-average cluster, with nothing but air under its feet. RSI at 78.2 is scorching. The 1h is in a bearish rebound, while the 4h and 1d are both capped below the cluster. BTC and ETH are both leaning bearish, so I’m not allowing any altcoin longs.
This isn’t a trend-following bull move. It’s a high-volume breakout candle emerging in a long-term downtrend—just a reversal test.
The dividing line isn’t 0.010097; it’s the top of the cluster down at 0.008507.
I’m not opening a position. I’ll just wait: if it retests without falling back below that line and the 1h stabilizes, then we can talk about going long. Chasing it now means buying into that FOMO.
💬 What do you think—a 2.6x volume surge breaking the previous high, a checklist score of 4 / 7, and 18.69% above the cluster—is this the bears really letting go, or a trap set for the pullback?
#ETH #BTC $ETH $BTC
🔥 It closed at 88% of the candle’s range, right near the top. That was a serious kick.
😑 But after going through my checklist, it’s 4 / 7. All the positives are volume and price action: volume up 2.68x, broke the previous high, closing position, CCI 280.
💢 What stops me is the distance—the price is +18.69% above the moving-average cluster, with nothing but air under its feet. RSI at 78.2 is scorching. The 1h is in a bearish rebound, while the 4h and 1d are both capped below the cluster. BTC and ETH are both leaning bearish, so I’m not allowing any altcoin longs.
This isn’t a trend-following bull move. It’s a high-volume breakout candle emerging in a long-term downtrend—just a reversal test.
The dividing line isn’t 0.010097; it’s the top of the cluster down at 0.008507.
I’m not opening a position. I’ll just wait: if it retests without falling back below that line and the 1h stabilizes, then we can talk about going long. Chasing it now means buying into that FOMO.
💬 What do you think—a 2.6x volume surge breaking the previous high, a checklist score of 4 / 7, and 18.69% above the cluster—is this the bears really letting go, or a trap set for the pullback?
#ETH #BTC $ETH $BTC