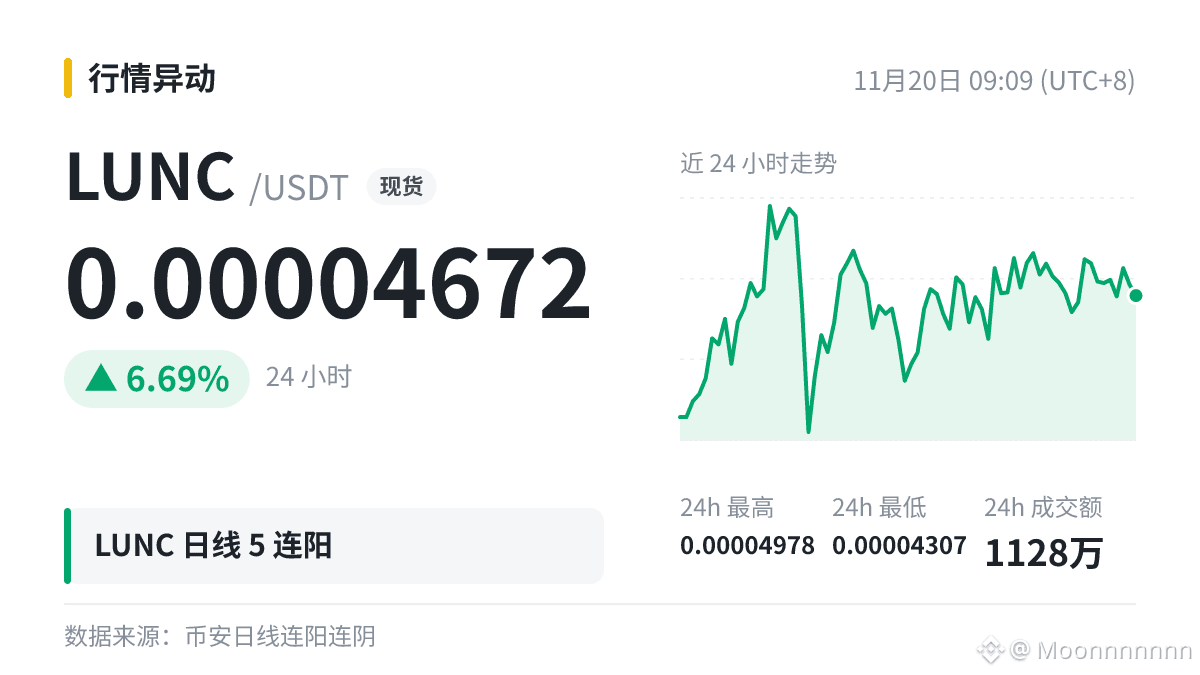
$LUNC daily chart has had 5 consecutive bullish candles, with a cumulative gain of +39.67% over that period. Today, it’s down -1.27% so far.
Let’s break that number down.
A candlestick compares the day’s own opening and closing prices; Binance trades continuously 24 hours a day, so the daily candle’s opening price is almost the same as the previous day’s closing price. That means a bullish close roughly corresponds to a rise from the previous day’s close.
Don’t change your plan because of a single number, and don’t gamble on one reading with borrowed money.
#LUNC
Let’s break that number down.
A candlestick compares the day’s own opening and closing prices; Binance trades continuously 24 hours a day, so the daily candle’s opening price is almost the same as the previous day’s closing price. That means a bullish close roughly corresponds to a rise from the previous day’s close.
Don’t change your plan because of a single number, and don’t gamble on one reading with borrowed money.
#LUNC