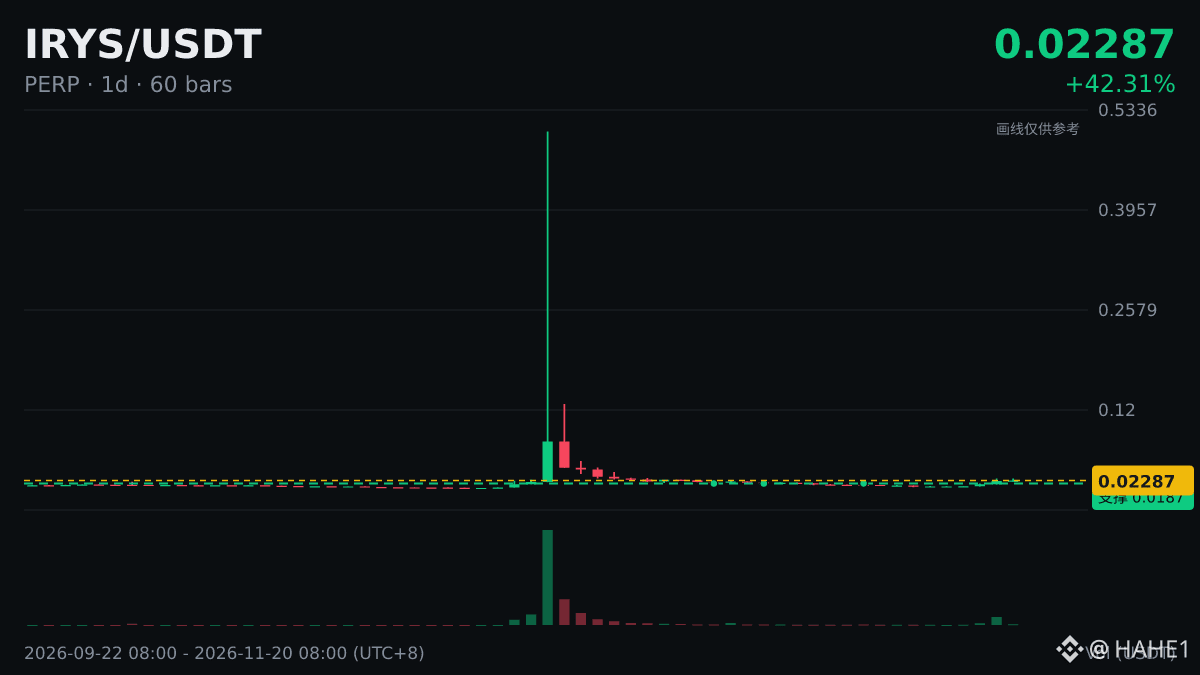
$IRYS daily chart with 5 consecutive bullish candles, cumulative +54.22%, current price 0.02283.
The meaning of consecutive bullish candles is that each candle closes above its open, showing buyers have held the initiative for several days. But after a total gain of 54.22% over 5 days, the rise has become somewhat steep, and the degree of price deviation from the moving average is increasing.
Key point to watch: on the day the streak is broken, is trading volume large, and can the pullback hold the breakout level.
Just listen for reference; don’t buy based on this, make your own decision.
The meaning of consecutive bullish candles is that each candle closes above its open, showing buyers have held the initiative for several days. But after a total gain of 54.22% over 5 days, the rise has become somewhat steep, and the degree of price deviation from the moving average is increasing.
Key point to watch: on the day the streak is broken, is trading volume large, and can the pullback hold the breakout level.
Just listen for reference; don’t buy based on this, make your own decision.