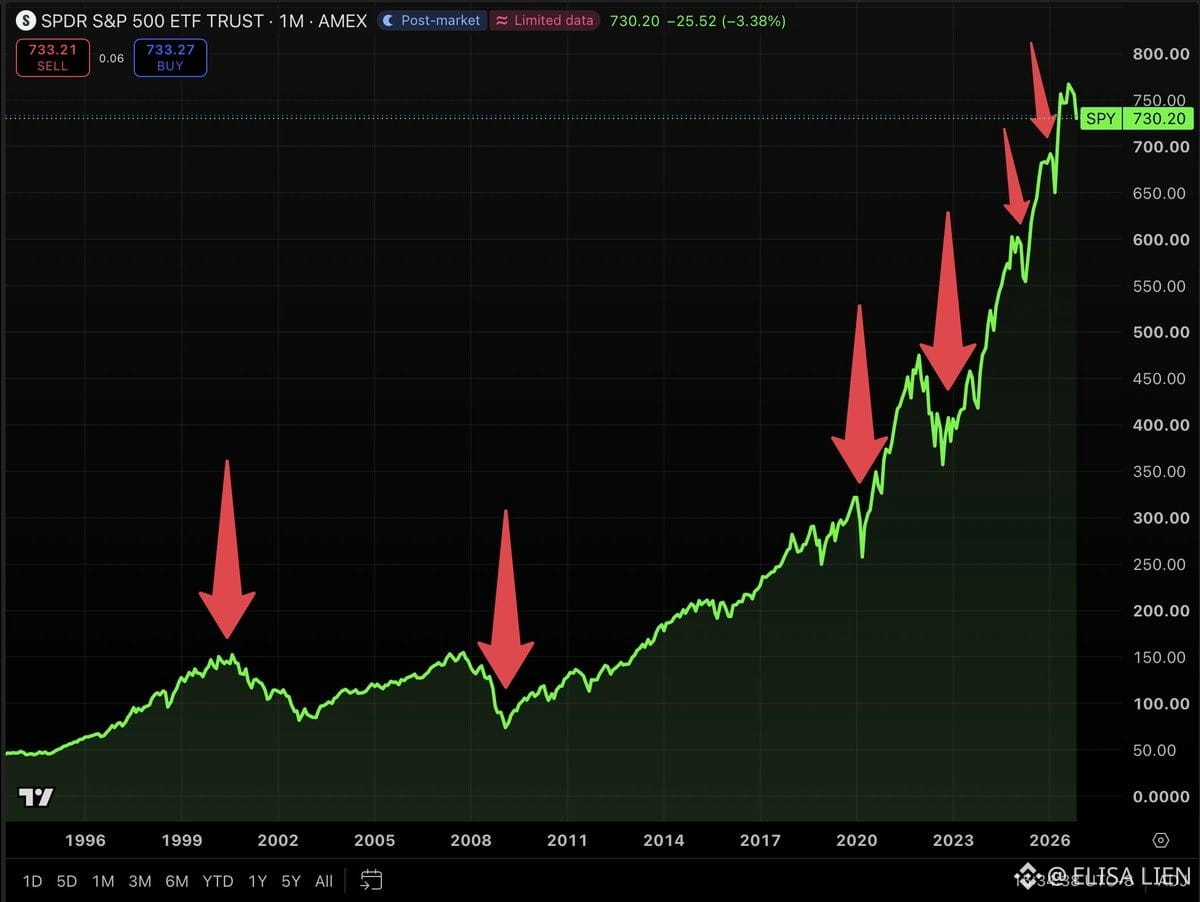
Do this now. Open $SPY
in TradingView & tap “All” (see chart below)
Look up 1999. The great dot-com crash. Now it’s hard to see.
Look up 2008. The worst financial crisis since the Great Depression. It’s just a small dip
Look up March 2020. The whole world came to a standstill. Barely visible
Look up 2022. Look up the crash caused by last April’s tariffs. Just a tiny line
Now look up this week. 5 straight red days & everyone’s panicking. It’s not even visible yet
All of it felt like the end of the world while we were going through it
That’s why everything I do has a long-term horizon.
Top-tier companies bought at attractive prices.
Stocks I almost never sell.
Options with 1–2 years until expiration.
Because no one knows what stocks will do in the short term.
On a chart with a long enough time frame... scary things shrink & earnings growth is what remains. That’s the signal.
Zoom out before you do something stupid.
in TradingView & tap “All” (see chart below)
Look up 1999. The great dot-com crash. Now it’s hard to see.
Look up 2008. The worst financial crisis since the Great Depression. It’s just a small dip
Look up March 2020. The whole world came to a standstill. Barely visible
Look up 2022. Look up the crash caused by last April’s tariffs. Just a tiny line
Now look up this week. 5 straight red days & everyone’s panicking. It’s not even visible yet
All of it felt like the end of the world while we were going through it
That’s why everything I do has a long-term horizon.
Top-tier companies bought at attractive prices.
Stocks I almost never sell.
Options with 1–2 years until expiration.
Because no one knows what stocks will do in the short term.
On a chart with a long enough time frame... scary things shrink & earnings growth is what remains. That’s the signal.
Zoom out before you do something stupid.