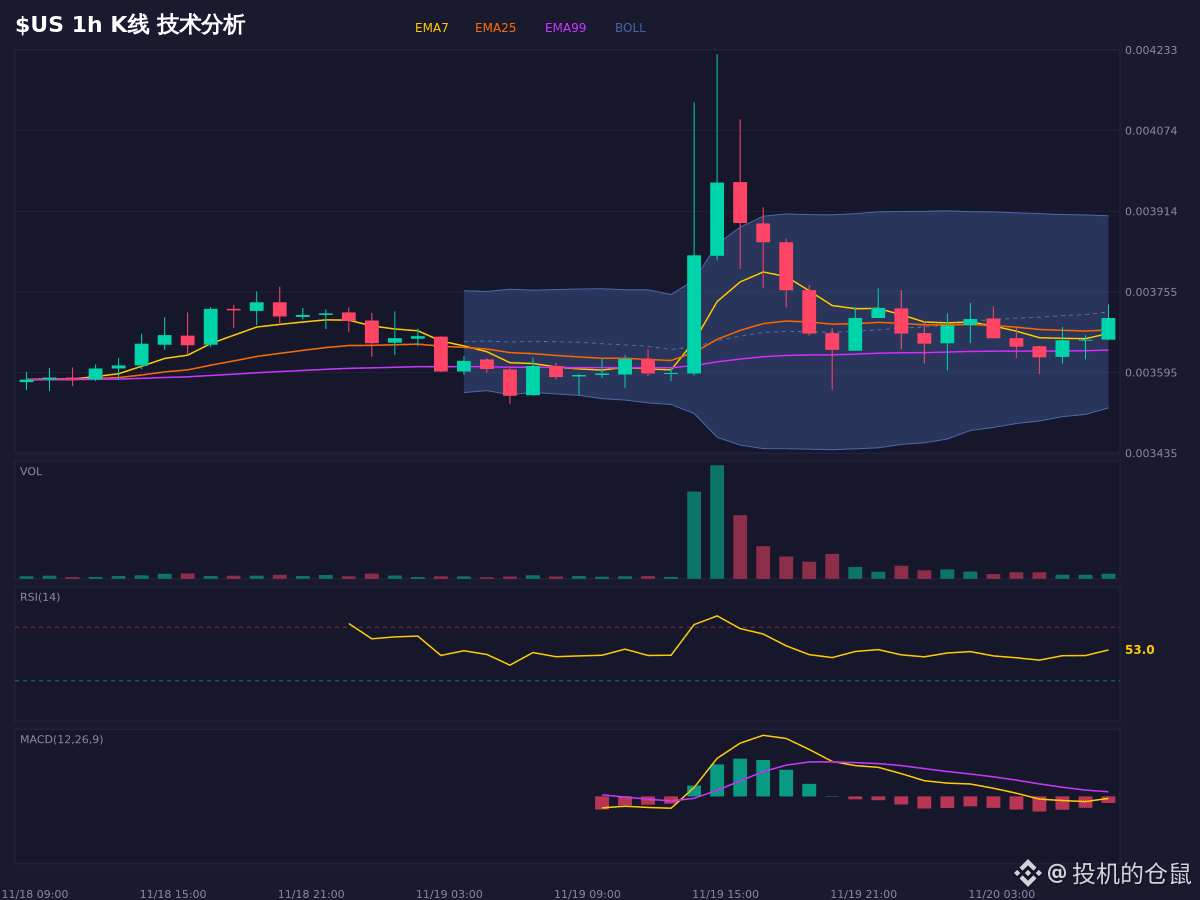
Wow, staring at the chart has nearly made my eyes pop out. $US is really a love-hate affair.
The most striking signal is the bearish divergence: the price hit a new high, but RSI didn’t follow. Technically, that’s a major warning sign. RSI suggests bullish momentum is healthy, but the Stoch RSI K line has crossed below the D line, signaling a short-term shift to bearish momentum. Quite a contradiction.
The price is currently below the middle Bollinger Band, and MACD also indicates bearish momentum, suggesting there isn’t enough strength to push prices higher. The key level to watch is EMA25 (0.00367963) as support. If the price holds above it, there may still be a rebound; if it breaks below, the weak structure could persist.
The bearish thesis would be invalidated at 0.00431893. A break above this level would invalidate the current bearish outlook.
For chart observation and conditional analysis only; this is not a record of any trading activity.
$US #永续合约 #市场情绪 #Spot
The most striking signal is the bearish divergence: the price hit a new high, but RSI didn’t follow. Technically, that’s a major warning sign. RSI suggests bullish momentum is healthy, but the Stoch RSI K line has crossed below the D line, signaling a short-term shift to bearish momentum. Quite a contradiction.
The price is currently below the middle Bollinger Band, and MACD also indicates bearish momentum, suggesting there isn’t enough strength to push prices higher. The key level to watch is EMA25 (0.00367963) as support. If the price holds above it, there may still be a rebound; if it breaks below, the weak structure could persist.
The bearish thesis would be invalidated at 0.00431893. A break above this level would invalidate the current bearish outlook.
For chart observation and conditional analysis only; this is not a record of any trading activity.
$US #永续合约 #市场情绪 #Spot