
HUMA's +6.24% BTC outperformance looks stretched
🔴 $HUMA - SHORT
Trade Plan:
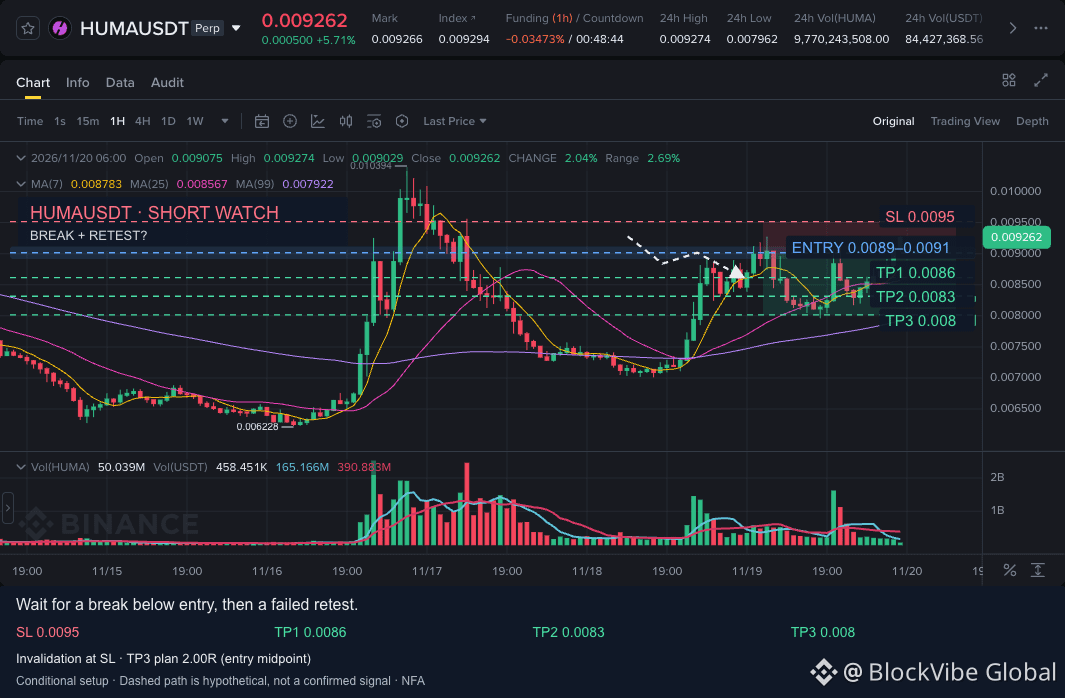
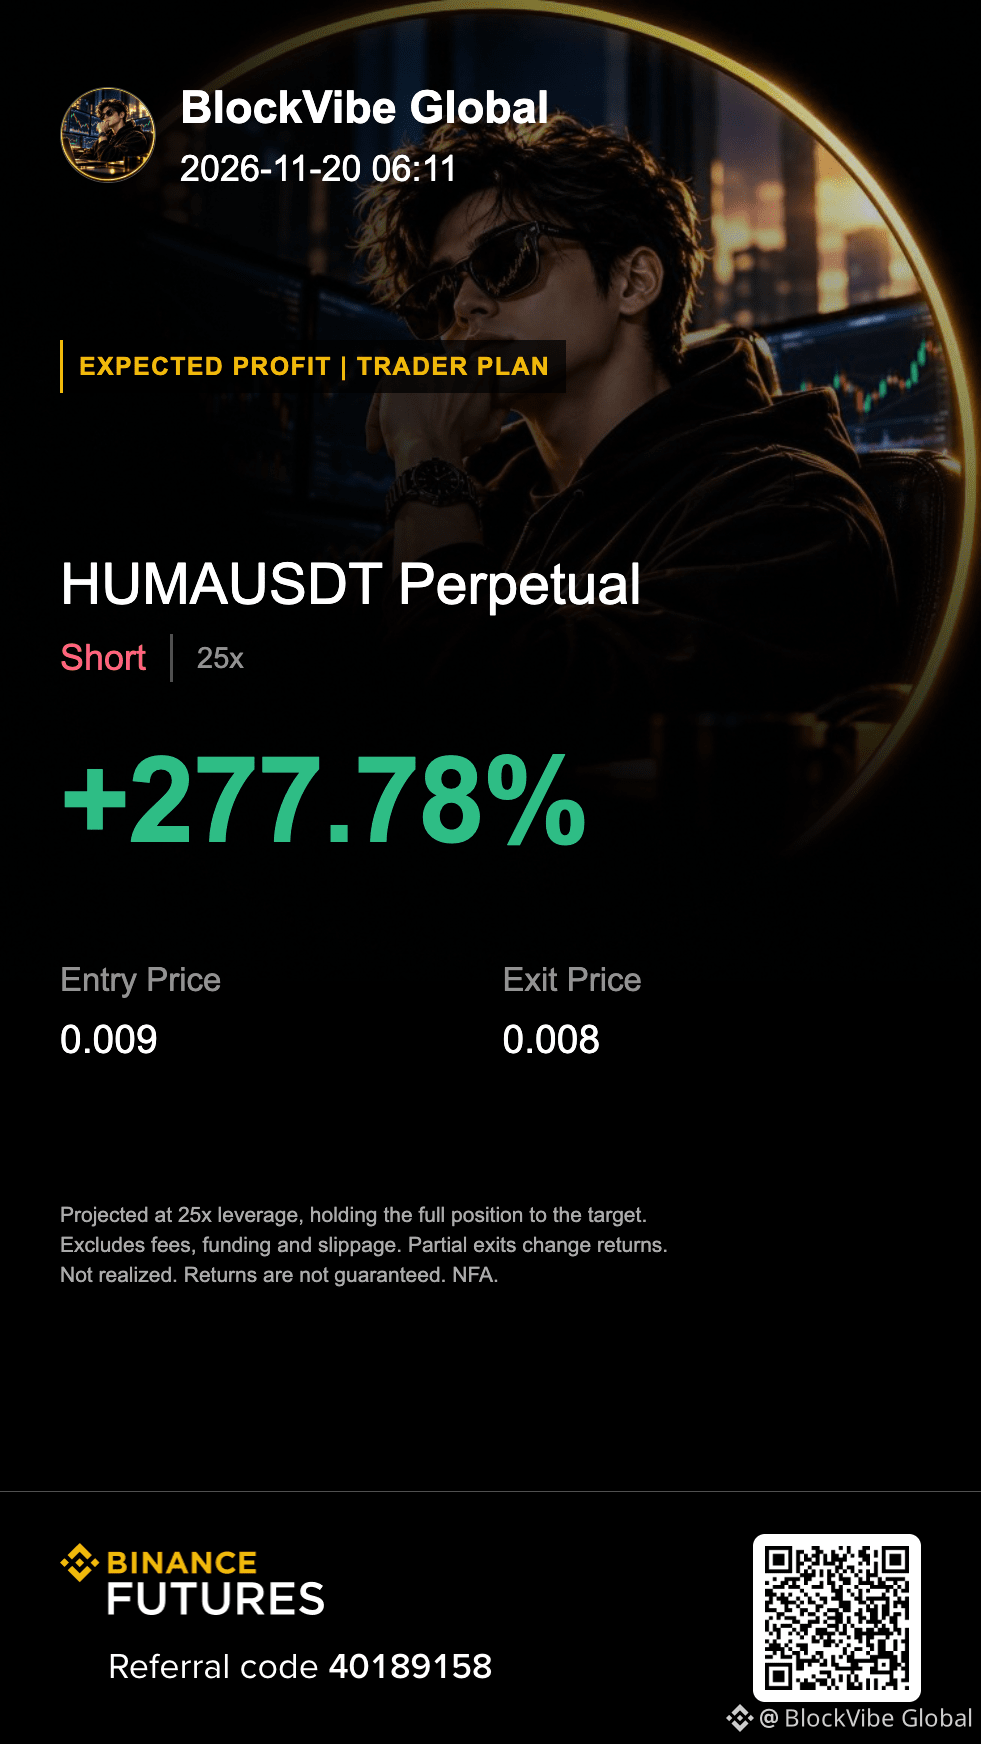
Entry Zone: 0.0089 – 0.0091
SL: 0.0095
TP1: 0.0086 | TP2: 0.0083 | TP3: 0.0080
Why this setup?
- The last two closed 4h candles overlapped with no clean direction, so the 0.0089–0.0091 band sits inside a mixed structure rather than a defined base.
- 15m RSI(14) at 72.0 is overbought on closed candles, so a push into the band would be an extended move rather than a fresh base.
- The last closed 15m candle ran 0.68x the twenty-candle mean — quiet — so the outperformance lacks volume confirmation.
HUMA beat BTC by 6.24 percentage points and rose 4.30% across four closed hourly candles, but hourly volume was only 0.55x median and open interest fell 0.95% — a thin rally into overbought RSI with funding at -0.0352%.
Risk: A 4h close above 0.0091 with volume expanding would show the rally is being backed by real demand rather than a thin squeeze.
Is HUMA's outperformance backed by buyers or just a thin, overbought squeeze?
DYOR & manage risk!
$HUMA
🔴 $HUMA - SHORT
Trade Plan:
Entry Zone: 0.0089 – 0.0091
SL: 0.0095
TP1: 0.0086 | TP2: 0.0083 | TP3: 0.0080
Why this setup?
- The last two closed 4h candles overlapped with no clean direction, so the 0.0089–0.0091 band sits inside a mixed structure rather than a defined base.
- 15m RSI(14) at 72.0 is overbought on closed candles, so a push into the band would be an extended move rather than a fresh base.
- The last closed 15m candle ran 0.68x the twenty-candle mean — quiet — so the outperformance lacks volume confirmation.
HUMA beat BTC by 6.24 percentage points and rose 4.30% across four closed hourly candles, but hourly volume was only 0.55x median and open interest fell 0.95% — a thin rally into overbought RSI with funding at -0.0352%.
Risk: A 4h close above 0.0091 with volume expanding would show the rally is being backed by real demand rather than a thin squeeze.
Is HUMA's outperformance backed by buyers or just a thin, overbought squeeze?
DYOR & manage risk!
$HUMA