#zil
Quick technical chart reading (15-minute timeframe)
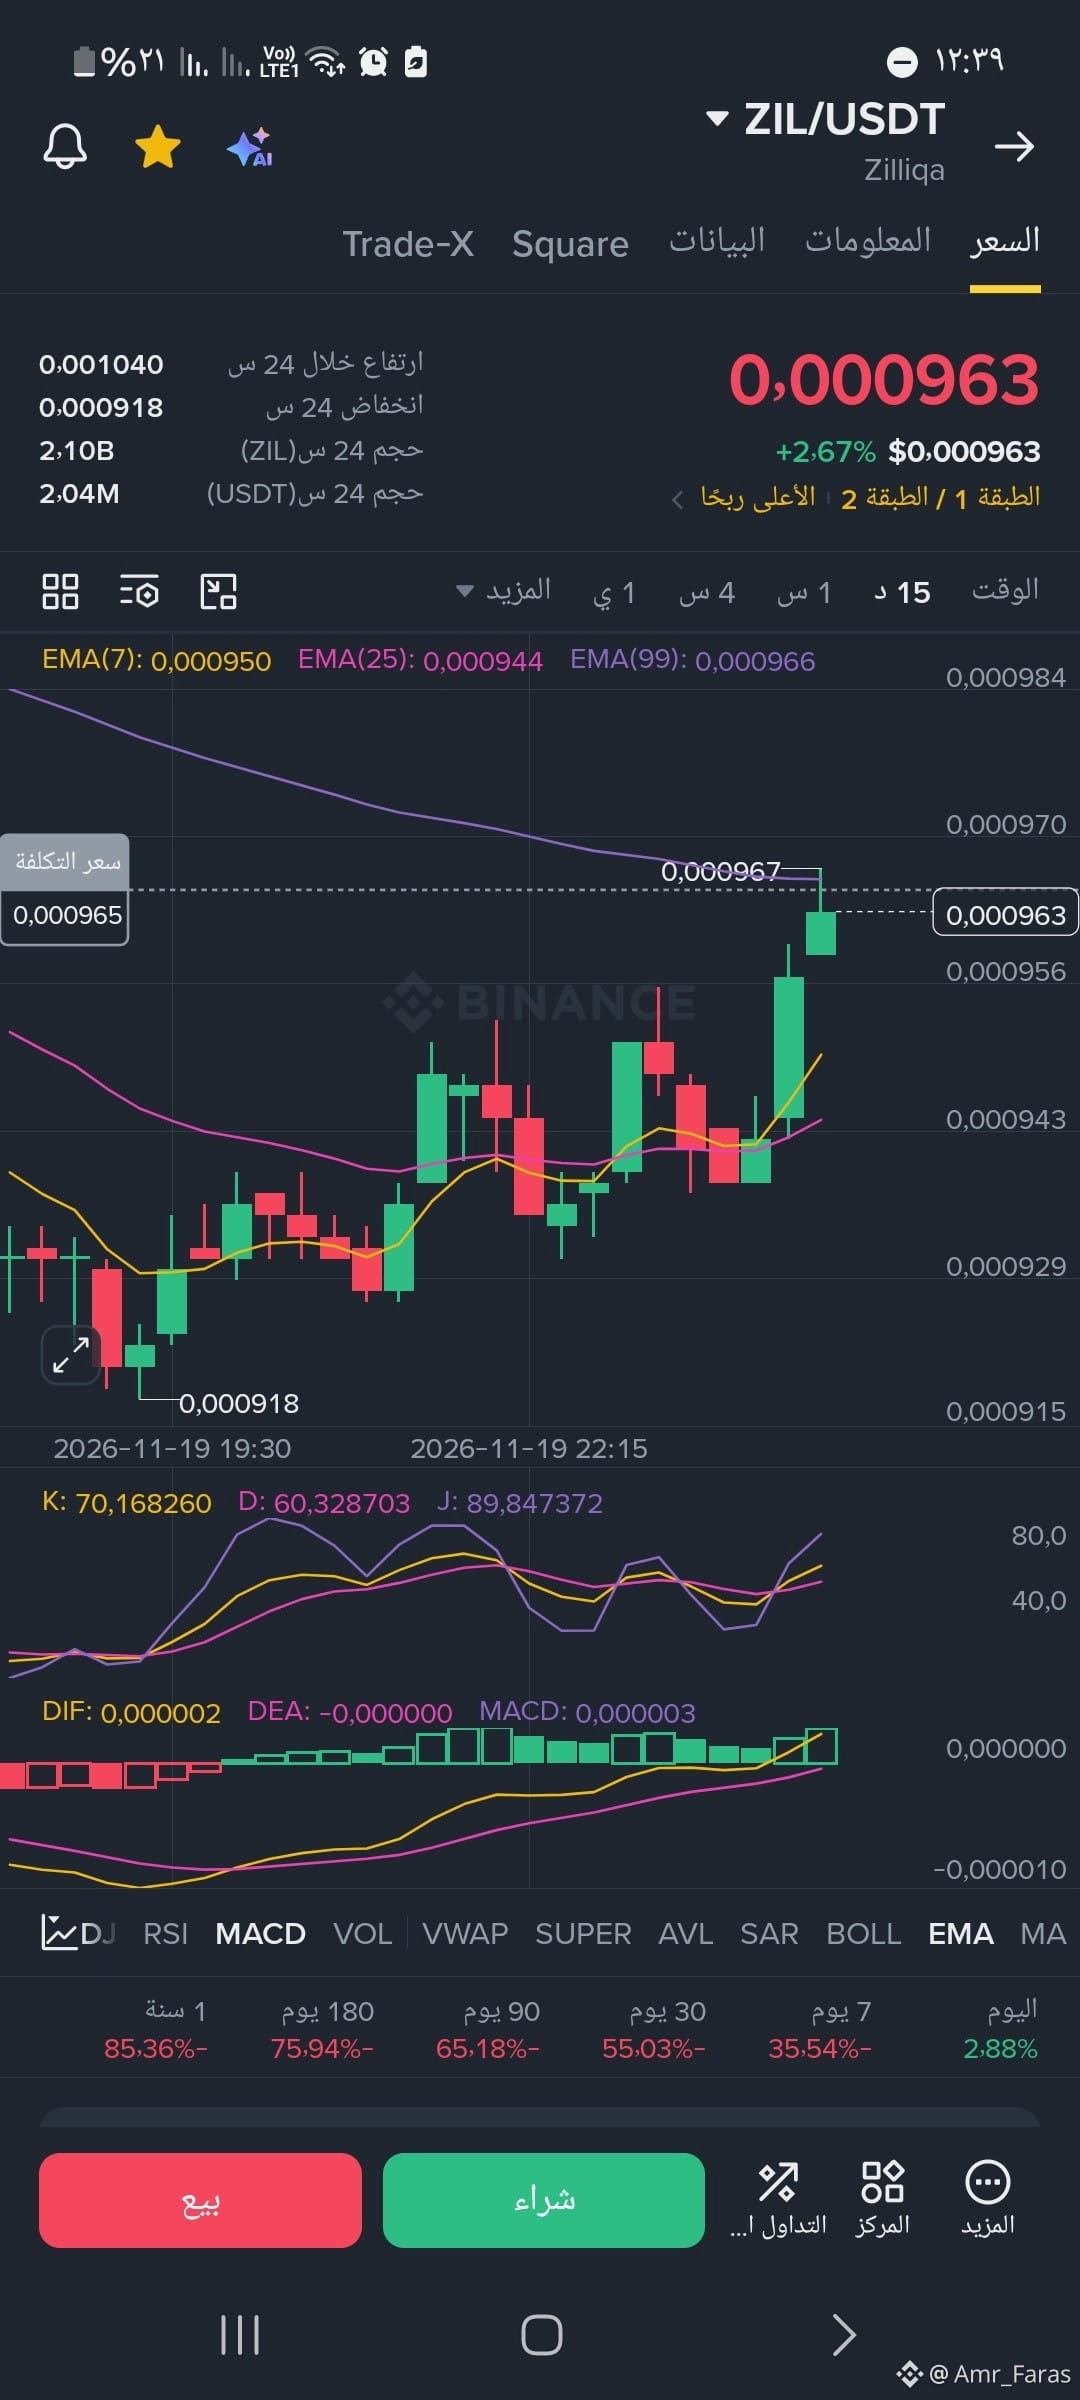
• Price action and moving averages. The price rebounded upward from a low of 0.000918 and is currently trading above the short-term averages, EMA(7) at 0.000950 and EMA(25) at 0.000944. It is currently facing immediate resistance at the long-term average, EMA(99) at 0.000966, which coincides with the latest candle wick at 0.000967.
• KDJ indicator. The indicator shows a positive bullish crossover, with the K line reaching 70.16 and the J line reaching 89.84, reflecting strong short-term buying momentum as it approaches the overbought zone.
• MACD indicator. The histogram has moved into positive green territory at 0.000003, with the DIF line crossing above the DEA line, supporting the continuation of the current upward attempt
Quick technical chart reading (15-minute timeframe)
• Price action and moving averages. The price rebounded upward from a low of 0.000918 and is currently trading above the short-term averages, EMA(7) at 0.000950 and EMA(25) at 0.000944. It is currently facing immediate resistance at the long-term average, EMA(99) at 0.000966, which coincides with the latest candle wick at 0.000967.
• KDJ indicator. The indicator shows a positive bullish crossover, with the K line reaching 70.16 and the J line reaching 89.84, reflecting strong short-term buying momentum as it approaches the overbought zone.
• MACD indicator. The histogram has moved into positive green territory at 0.000003, with the DIF line crossing above the DEA line, supporting the continuation of the current upward attempt