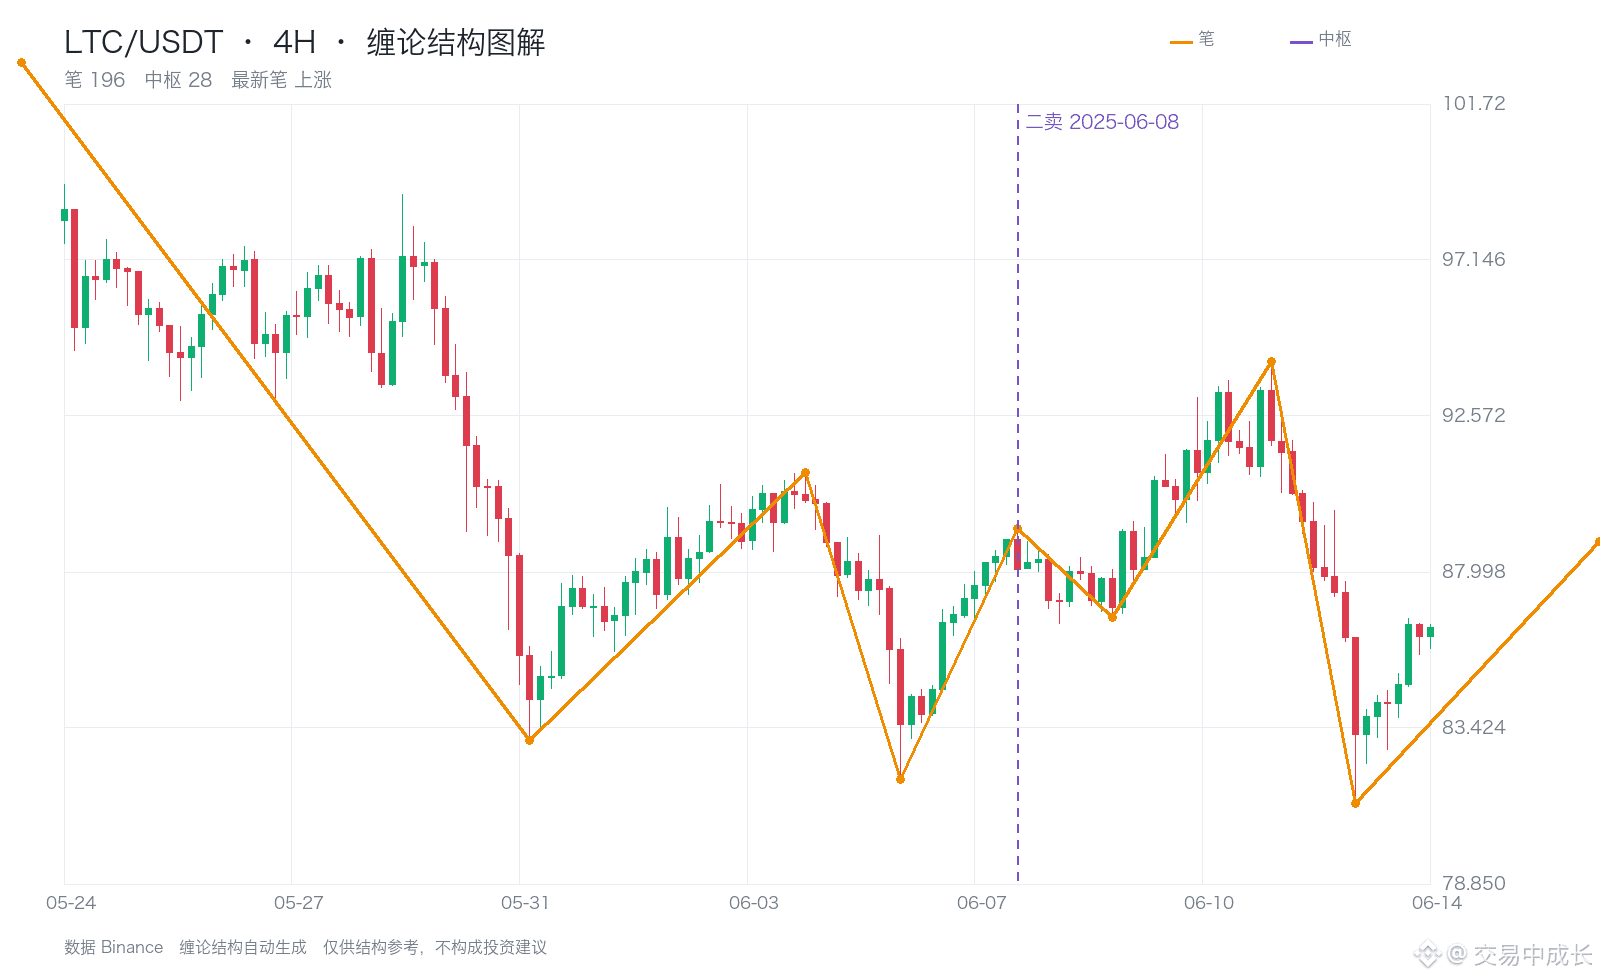
A look back at a historical case: On June 8, 2025, the engine identified the 4h structure for LTC as a second sell signal.
The previous sell marker for this signal was at 90.920, and the marker price of 89.270 was below this reference price.
Within the next 20 candles, the price moved against the signal to 93.610. The maximum adverse movement relative to the marker price was 4.9%, and the closing price at the end of the window was 91.820.
This example reminds us that after seeing a buy or sell marker, we should also check the subsequent structure and invalidation conditions.
This is a retrospective review of the structure. The period’s highest and lowest prices do not equal actual trading returns, nor do they mean the signal could have been confirmed at the time.
$LTC $BTC $ETH #缠论 #利率预期 #Solana ecosystem
The previous sell marker for this signal was at 90.920, and the marker price of 89.270 was below this reference price.
Within the next 20 candles, the price moved against the signal to 93.610. The maximum adverse movement relative to the marker price was 4.9%, and the closing price at the end of the window was 91.820.
This example reminds us that after seeing a buy or sell marker, we should also check the subsequent structure and invalidation conditions.
This is a retrospective review of the structure. The period’s highest and lowest prices do not equal actual trading returns, nor do they mean the signal could have been confirmed at the time.
$LTC $BTC $ETH #缠论 #利率预期 #Solana ecosystem