$YB A quick look at the YBUSDT perpetual contract ⚡
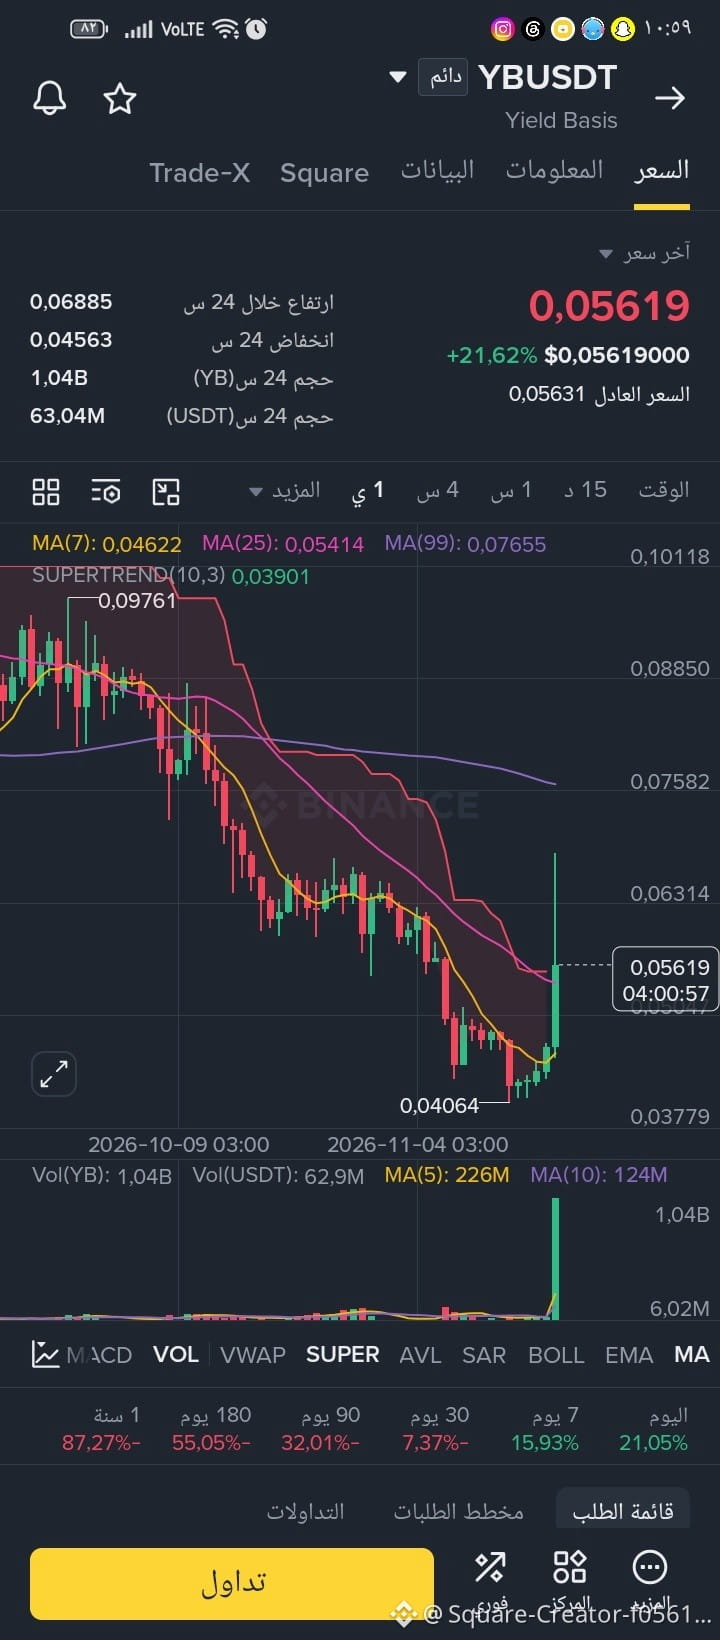
A sharp, sudden bullish rebound in YBUSDT followed a prolonged downtrend from previous highs near 0.09761 to a local low of 0.04064, accompanied by a clear spike in trading volume.
Key figures and indicators
Current price: 0.05619, up approximately +21.62% (fair price: 0.05631).
24-hour range: between a low of 0.04563 and a high of 0.06885.
Liquidity and volume: approximately 1.04B YB and around 63.04M USDT traded over 24 hours, with a notable volume bar clearly exceeding previous averages.
Moving averages (MA): The price broke above MA(7) at 0.04622 and MA(25) at 0.05414, but remains below the declining MA(99) at 0.07655.
Supertrend indicator (10,3): At 0.03901, below the recent upward move, reflecting a short-term positive shift after the rebound from the low.
Performance over time: strong gains today (+21.05%) and over 7 days (+15.93%), compared with steeper declines over longer periods: 30 days (-7.37%), 90 days (-32.01%), 180 days (-55.05%), and 1 year (-87.27%).
A sharp, sudden bullish rebound in YBUSDT followed a prolonged downtrend from previous highs near 0.09761 to a local low of 0.04064, accompanied by a clear spike in trading volume.
Key figures and indicators
Current price: 0.05619, up approximately +21.62% (fair price: 0.05631).
24-hour range: between a low of 0.04563 and a high of 0.06885.
Liquidity and volume: approximately 1.04B YB and around 63.04M USDT traded over 24 hours, with a notable volume bar clearly exceeding previous averages.
Moving averages (MA): The price broke above MA(7) at 0.04622 and MA(25) at 0.05414, but remains below the declining MA(99) at 0.07655.
Supertrend indicator (10,3): At 0.03901, below the recent upward move, reflecting a short-term positive shift after the rebound from the low.
Performance over time: strong gains today (+21.05%) and over 7 days (+15.93%), compared with steeper declines over longer periods: 30 days (-7.37%), 90 days (-32.01%), 180 days (-55.05%), and 1 year (-87.27%).