All 3 coins are bearish on the 4-hour and daily charts. A multi-timeframe confluence bearish signal is here 🔥
════════════════════
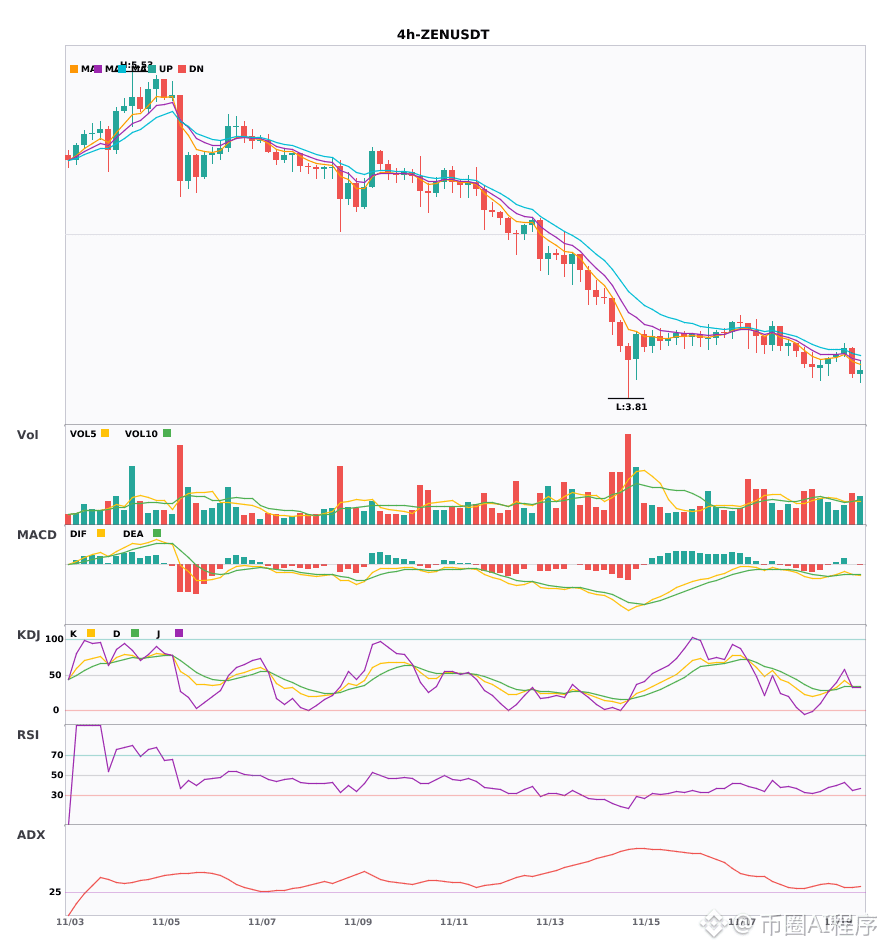
🟢 $ZEN 4-hour Bearish Signal
⚠️ Technical analysis: 4-hour entry: MACD bearish crossover below zero, with expanding green bars; moving averages are bearishly aligned and diverging downward; KDJ bearish crossover, not yet oversold. Daily bearish confluence confirmed—a multi-timeframe bearish signal.
════════════════════
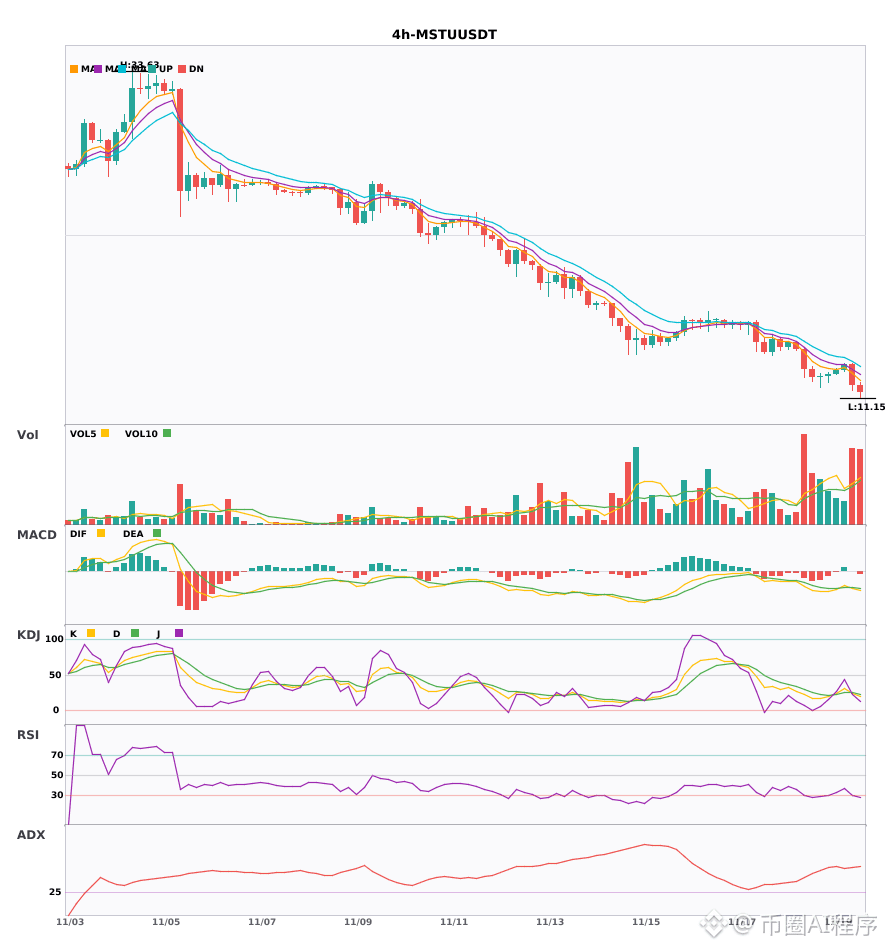
🟢 $MSTU 4-hour Bearish Signal
⚠️ Technical analysis: Daily and 4-hour bearish confluence confirmed! MACD bearish crossover below zero with volume, moving averages bearishly aligned and pointing downward, KDJ bearish crossover but not yet oversold, and trading volume up 2x. The confluence bearish signal is clear.
════════════════════
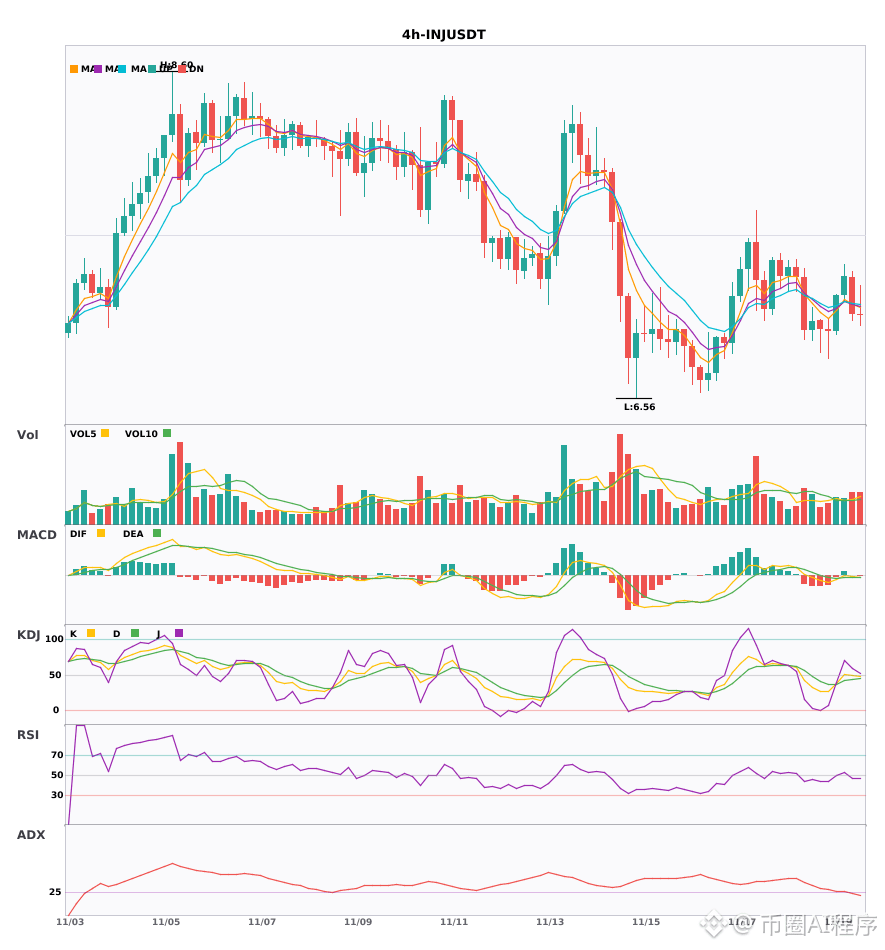
🟢 $INJ 4-hour Bearish Signal
⚠️ Technical analysis: 4-hour and daily bearish confluence. MACD bearish crossover below the zero line; EMA5 crossed below EMA8, forming a bearish alignment; KDJ bearish crossover, with K below D, indicating weakness; volume up 1.3x. Bearish signal.
════════════════════
🔔 Follow for real-time market updates 🔔
#多周期共振 #ZEN #MSTU #INJ
📌 When trading, watch whether the candlestick patterns confirm the signal
════════════════════
🟢 $ZEN 4-hour Bearish Signal
⚠️ Technical analysis: 4-hour entry: MACD bearish crossover below zero, with expanding green bars; moving averages are bearishly aligned and diverging downward; KDJ bearish crossover, not yet oversold. Daily bearish confluence confirmed—a multi-timeframe bearish signal.
════════════════════
🟢 $MSTU 4-hour Bearish Signal
⚠️ Technical analysis: Daily and 4-hour bearish confluence confirmed! MACD bearish crossover below zero with volume, moving averages bearishly aligned and pointing downward, KDJ bearish crossover but not yet oversold, and trading volume up 2x. The confluence bearish signal is clear.
════════════════════
🟢 $INJ 4-hour Bearish Signal
⚠️ Technical analysis: 4-hour and daily bearish confluence. MACD bearish crossover below the zero line; EMA5 crossed below EMA8, forming a bearish alignment; KDJ bearish crossover, with K below D, indicating weakness; volume up 1.3x. Bearish signal.
════════════════════
🔔 Follow for real-time market updates 🔔
#多周期共振 #ZEN #MSTU #INJ
📌 When trading, watch whether the candlestick patterns confirm the signal