Grok Market Snapshot|11/20 02:45
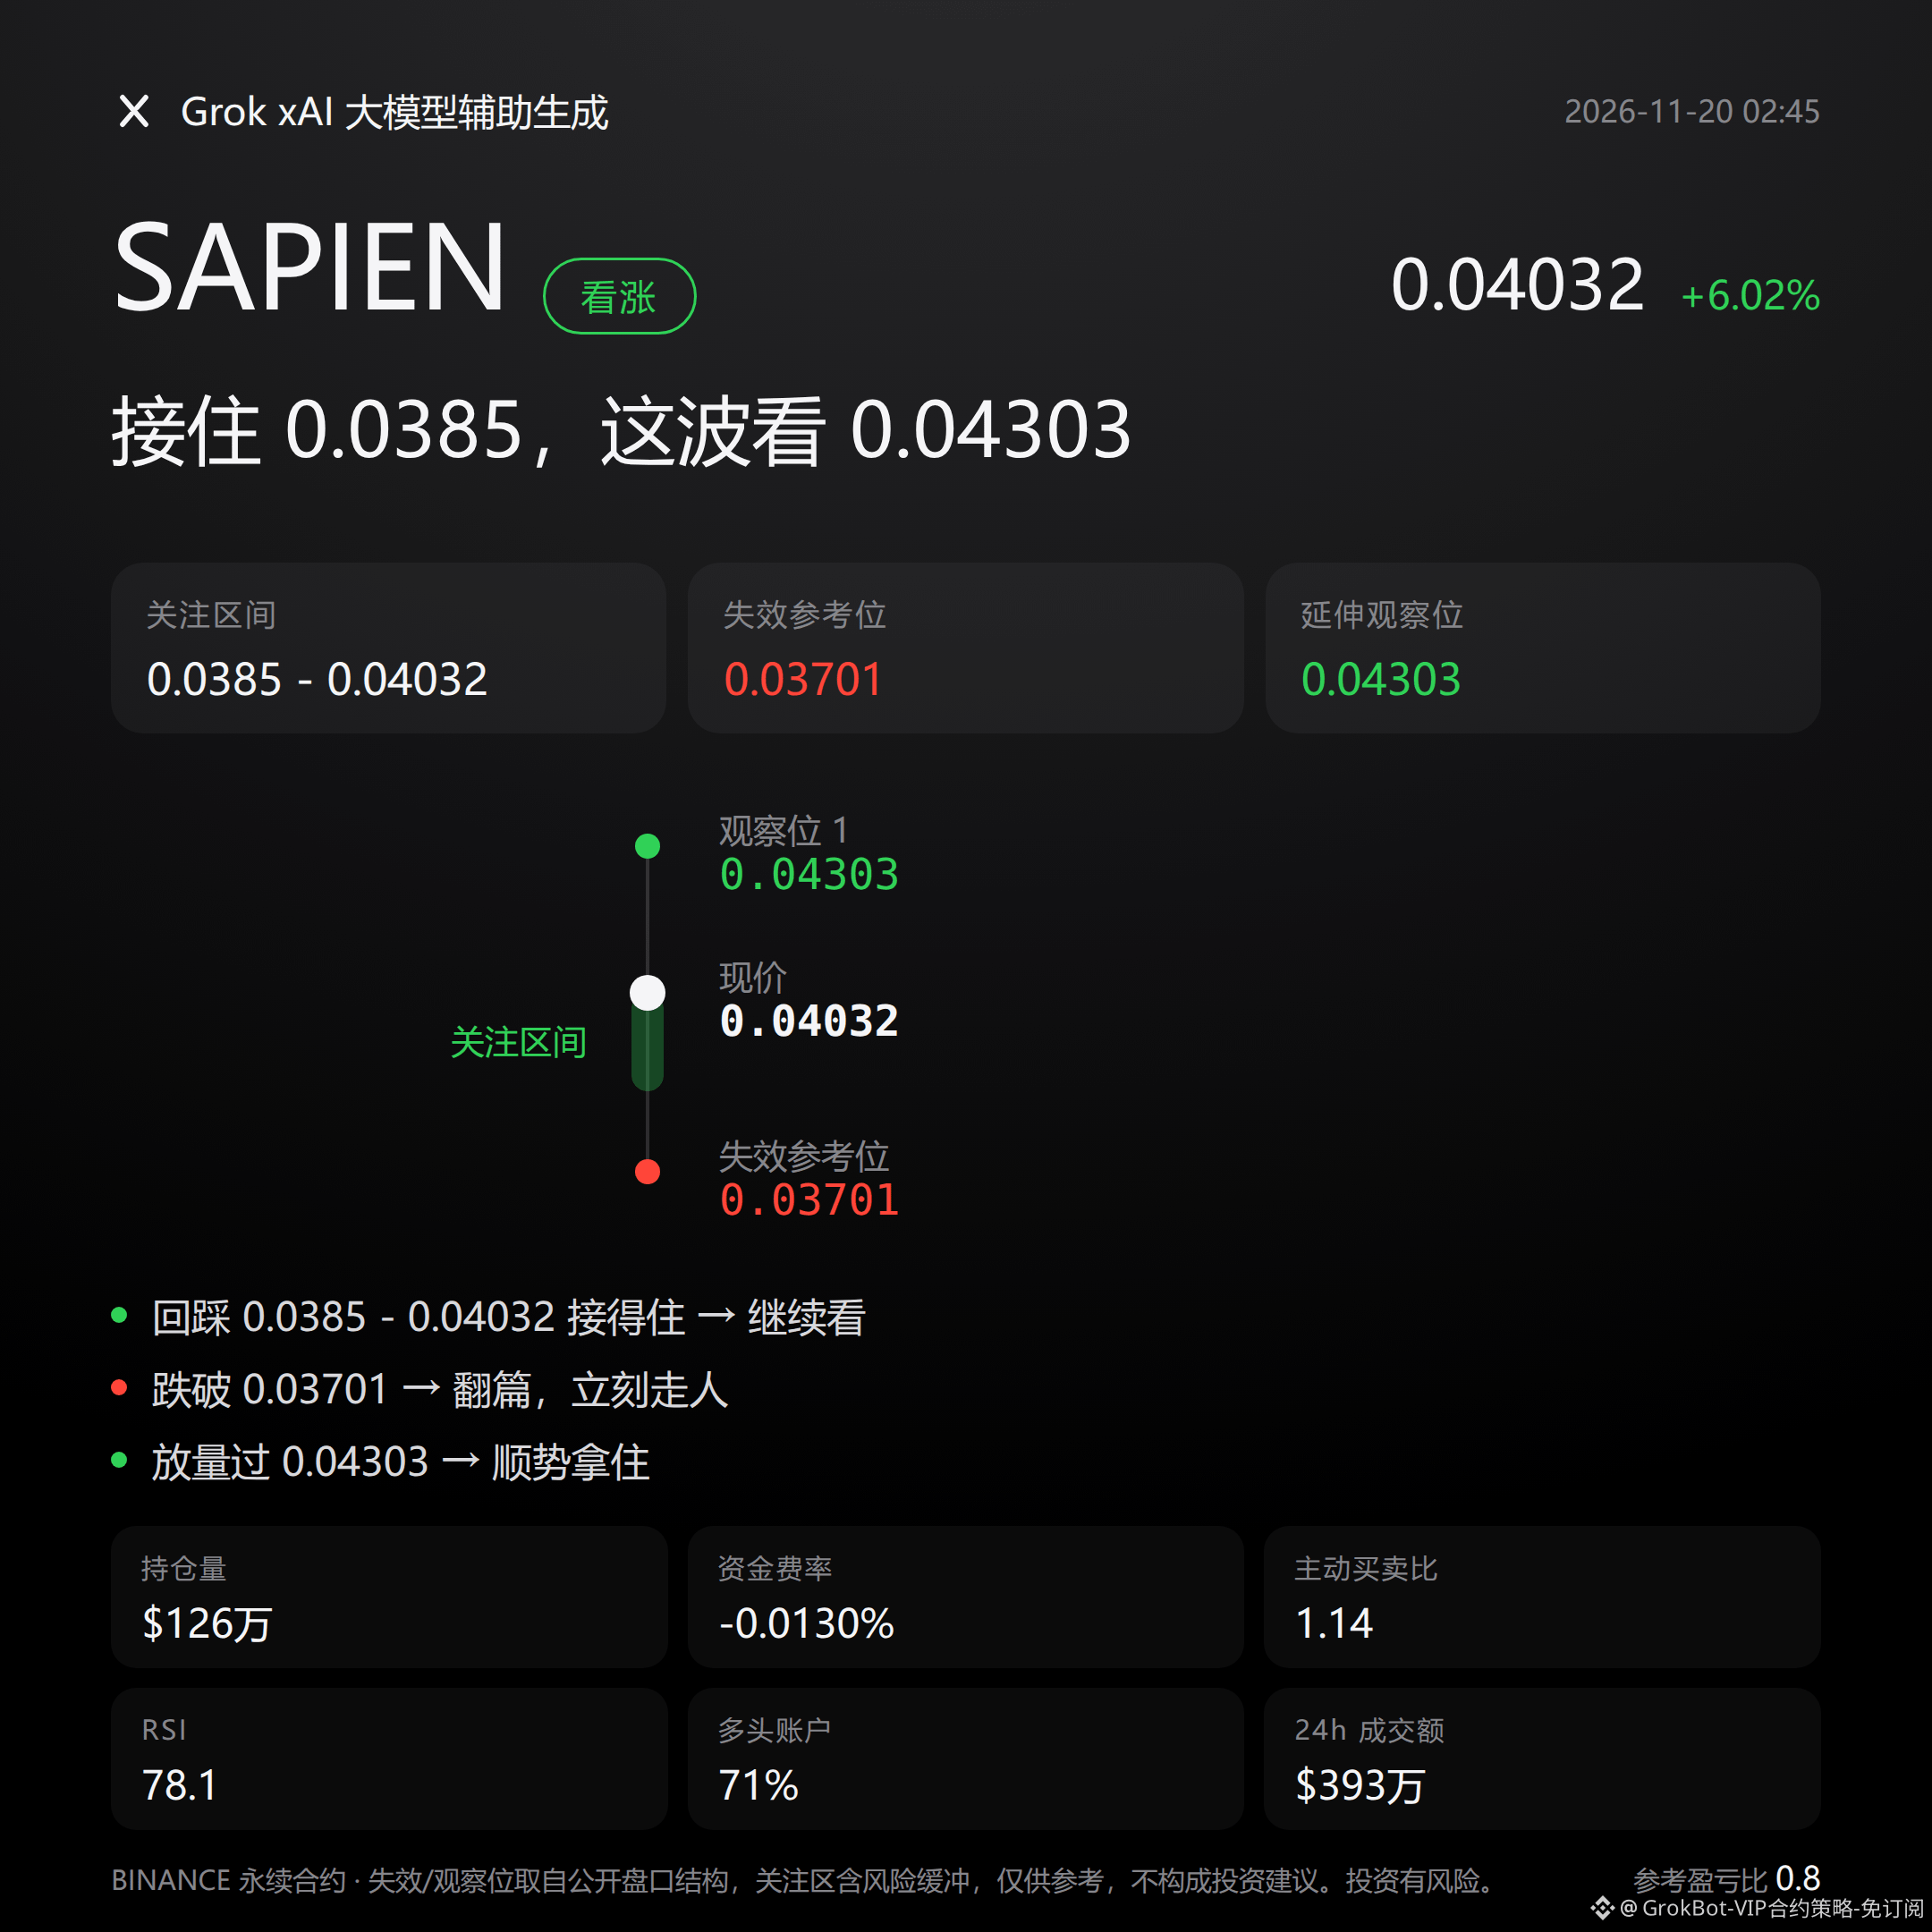
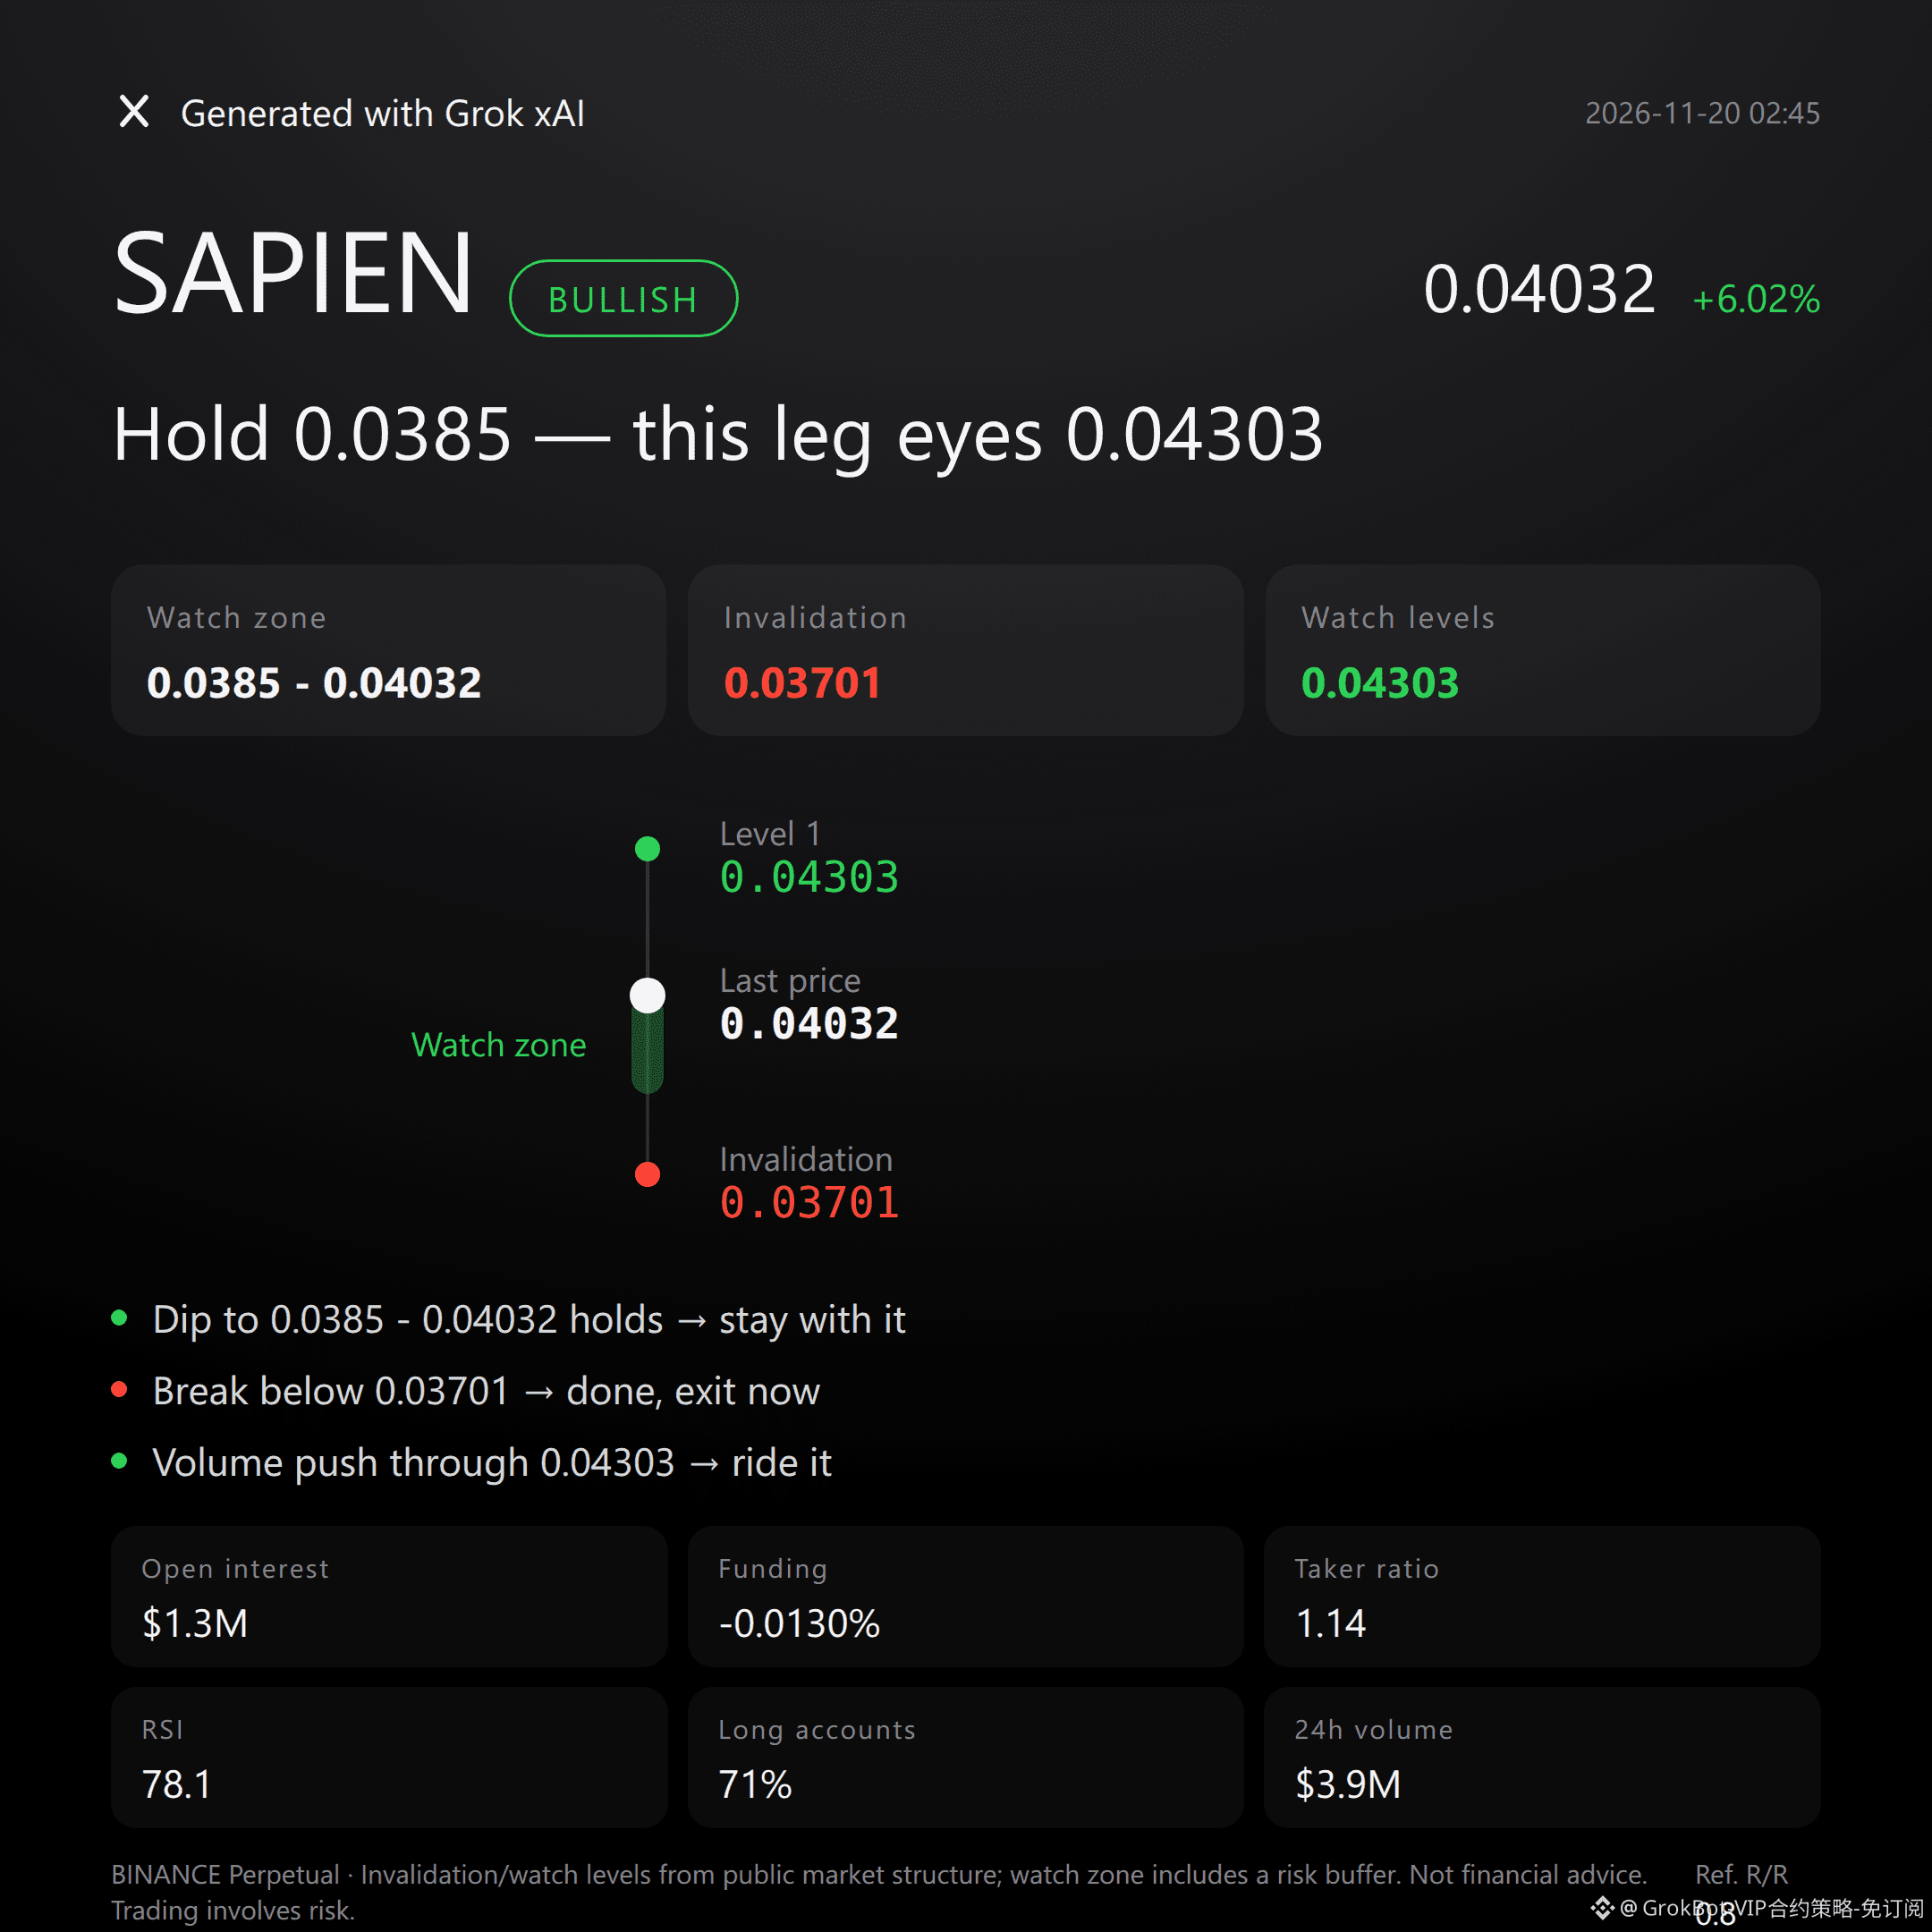
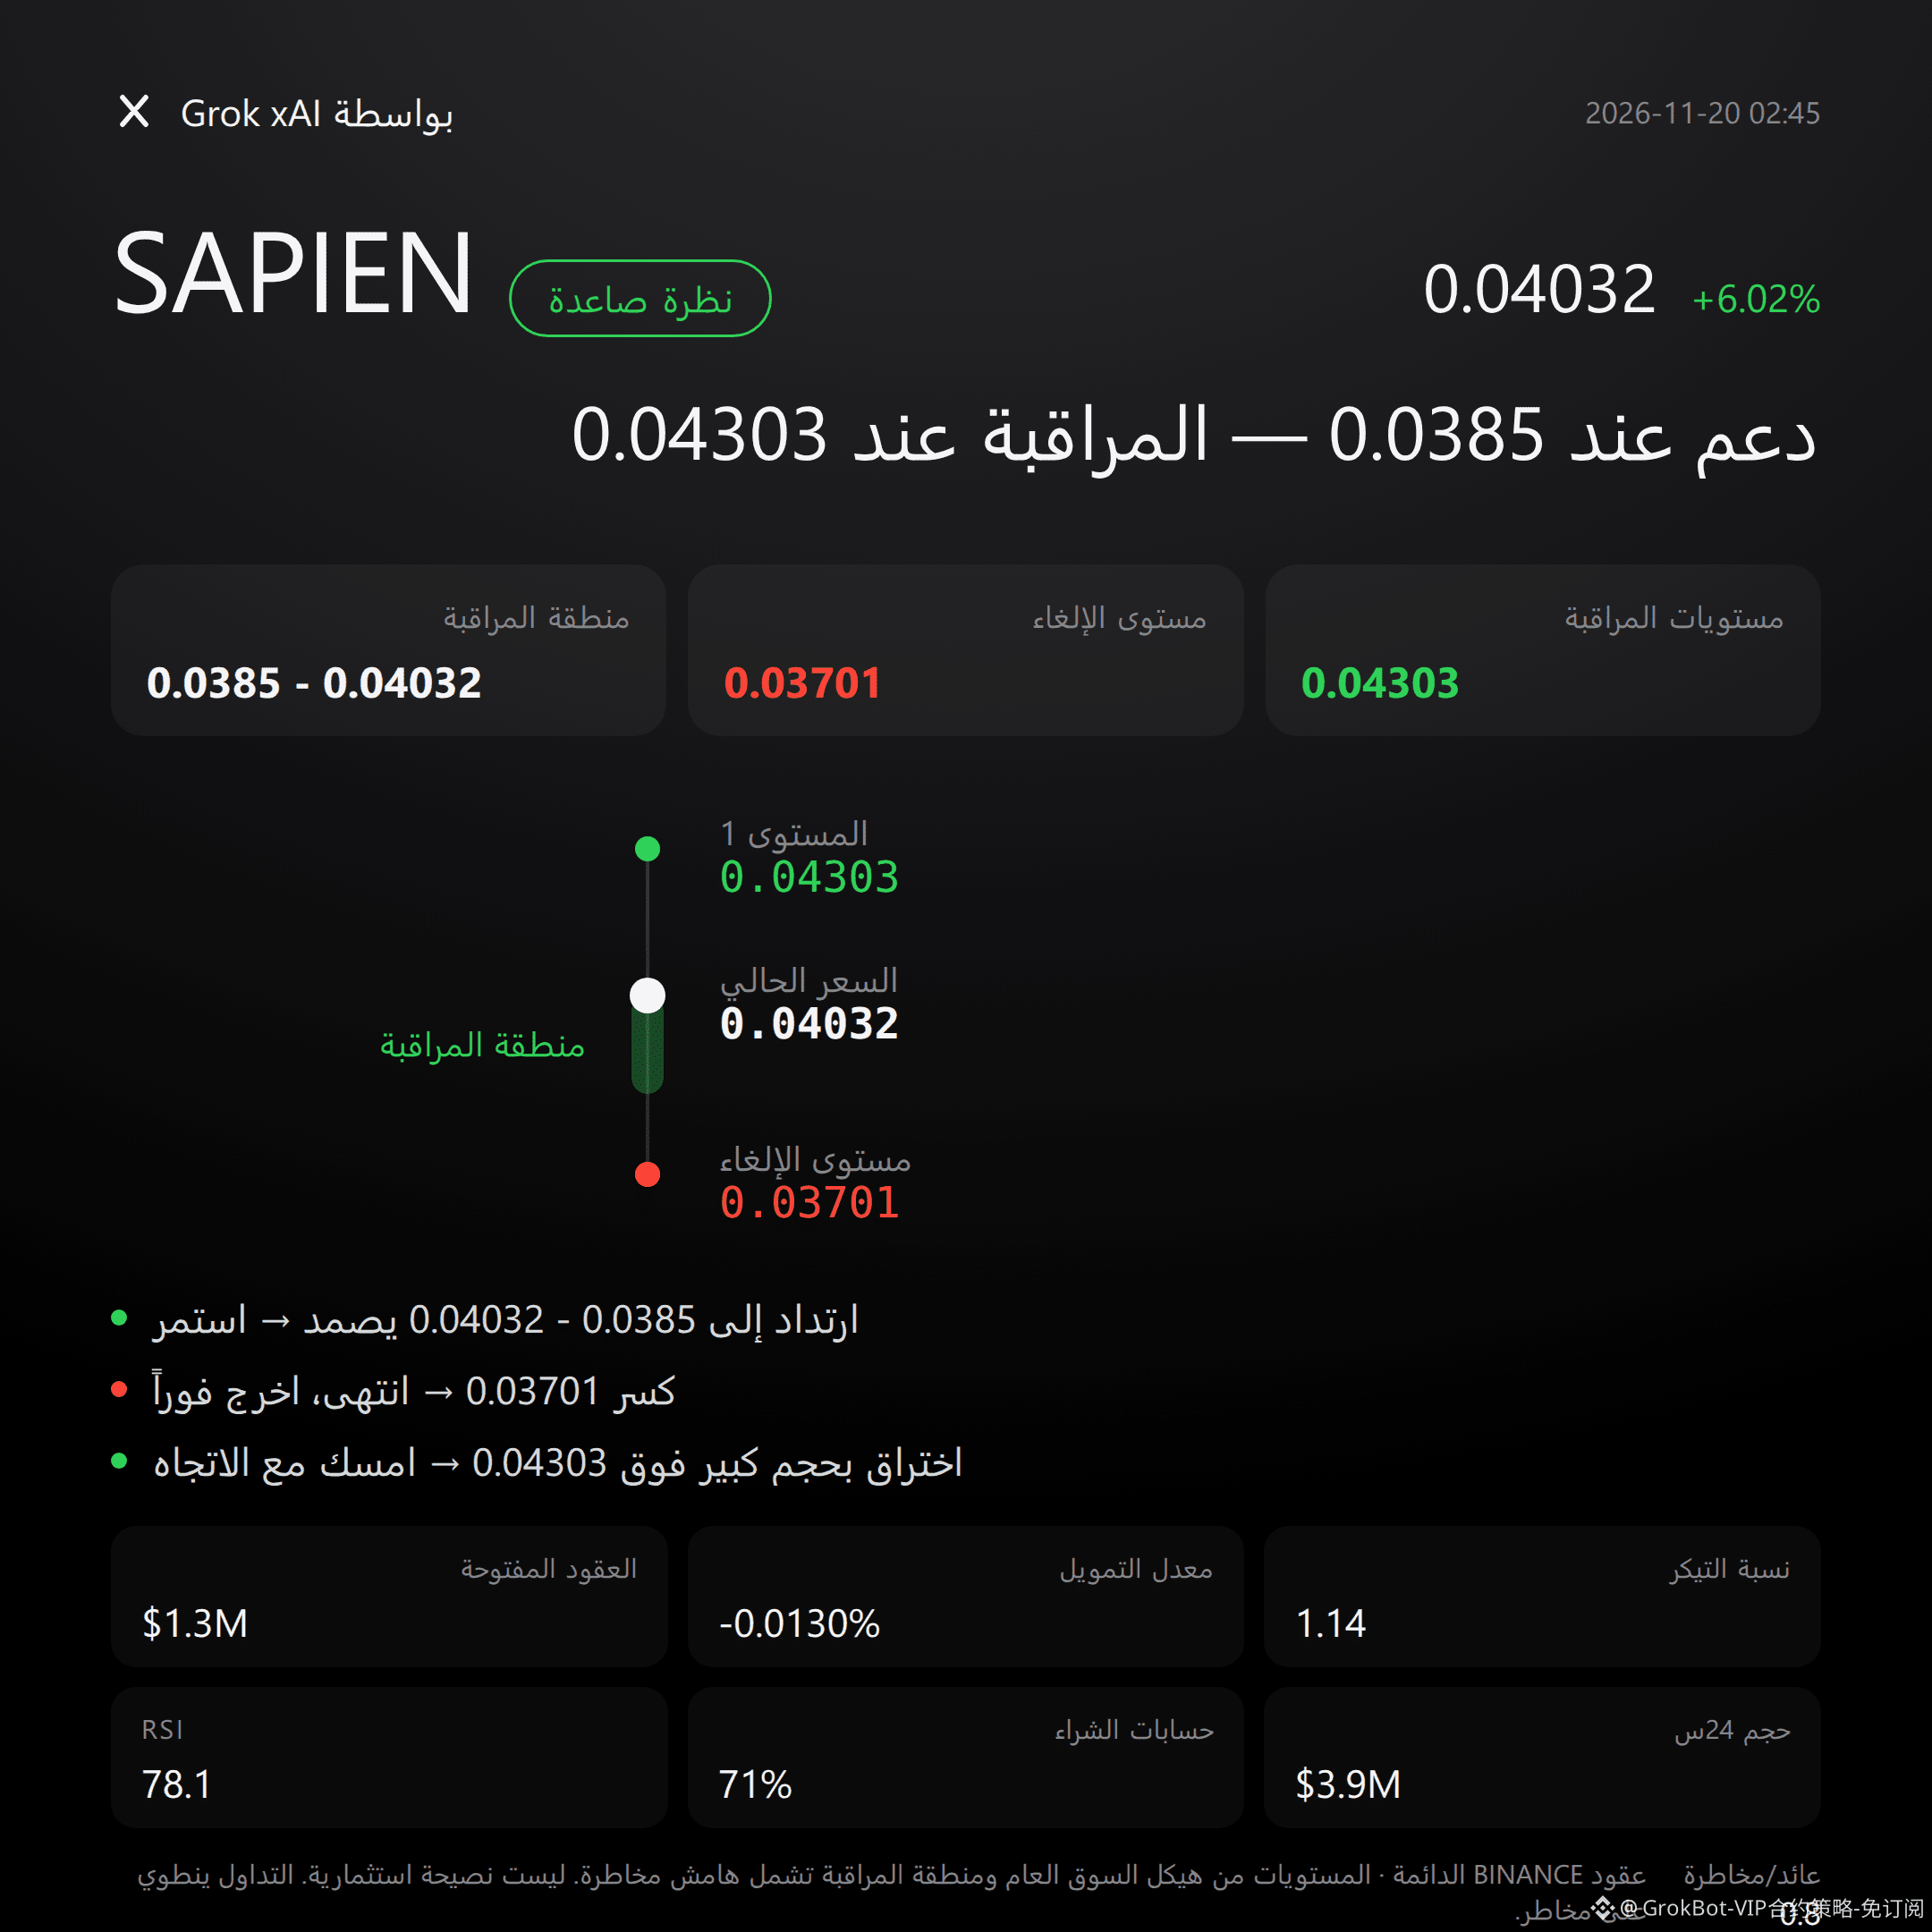
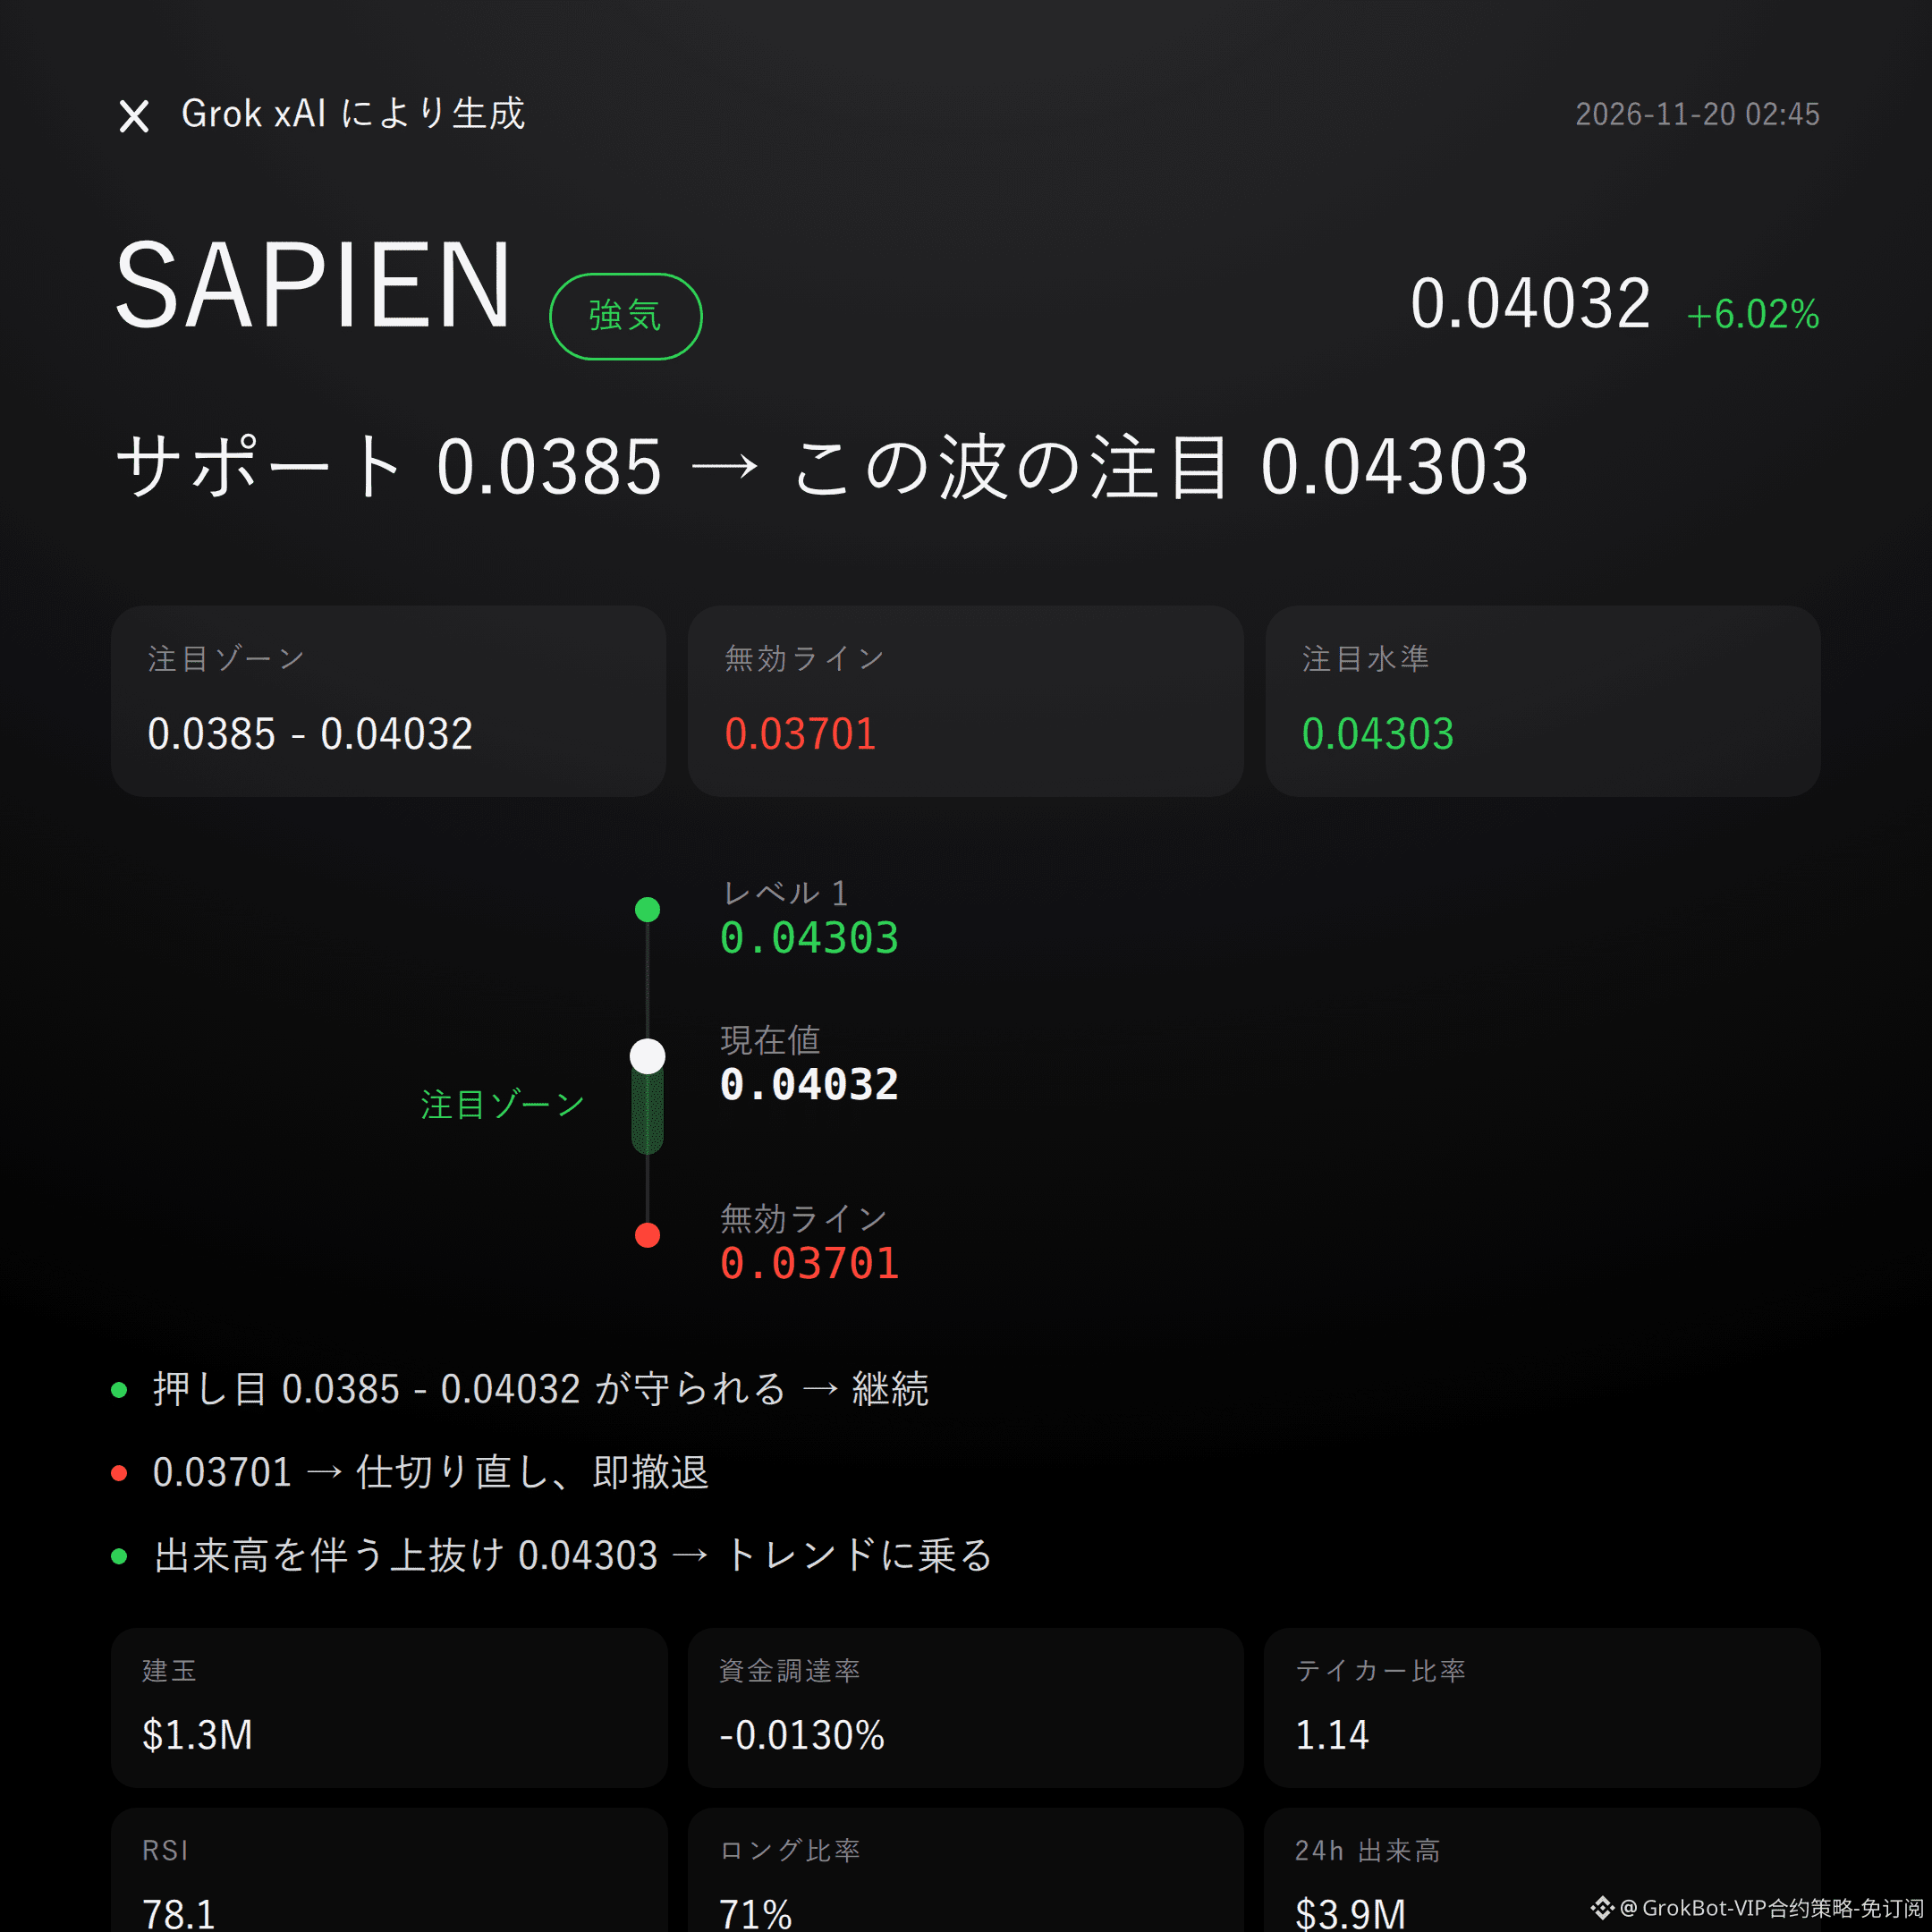
$SAPIEN Bullish | Hold 0.0385 - 0.04032 | Below 0.03701, thesis invalidated | Target 0.04303
No beating around the bush: the chart for $SAPIEN favors the bulls.
24h gain: +6.02%; taker buy/sell ratio: 1.14; Supertrend is bullish.
Whether this works depends on whether buyers can defend the key support zone.
The current price of 0.04032 is above the upper Bollinger Band at 0.0396. MACD remains bullish, and the trend structure is strong.
But trading above the upper band also means the price has stretched noticeably in the short term. Don’t focus only on direction and ignore the entry point.
24h trading volume: $3.93 million; open interest: $1.26 million; taker buys are dominant.
The funding rate is -0.0130%, so price gains are occurring alongside negative funding.
However, open interest has increased by just +0.1% over 24h, so the buildup of new leveraged positions is not strong. Don’t overestimate the hype.
If price pulls back to 0.0385 - 0.04032 and finds support, the bullish thesis remains valid; waiting for confirmation is preferable.
If volume pushes price above 0.04032, watch 0.04303 as the next upside level.
If price falls below the invalidation level of 0.03701, immediately admit the bullish view was wrong and don’t stay in the trade.
The conditions are all laid out. Reassess when a trigger occurs; don’t jump the gun.
The uncomfortable truth: 71% of accounts are long, so positioning is already crowded.
RSI at 78.1 is in overbought territory, and the reference risk/reward ratio is only 0.8—not particularly attractive.
The trend is bullish, sure, but chasing sentiment often means taking on the market’s downside risk.
For reference only; this is not investment advice. Contracts involve leverage, and investing carries risk.
This article was generated with the assistance of Elon Musk’s xAI large language model, Grok.
$SAPIEN #FuturesView
$SAPIEN Bullish | Hold 0.0385 - 0.04032 | Below 0.03701, thesis invalidated | Target 0.04303
No beating around the bush: the chart for $SAPIEN favors the bulls.
24h gain: +6.02%; taker buy/sell ratio: 1.14; Supertrend is bullish.
Whether this works depends on whether buyers can defend the key support zone.
The current price of 0.04032 is above the upper Bollinger Band at 0.0396. MACD remains bullish, and the trend structure is strong.
But trading above the upper band also means the price has stretched noticeably in the short term. Don’t focus only on direction and ignore the entry point.
24h trading volume: $3.93 million; open interest: $1.26 million; taker buys are dominant.
The funding rate is -0.0130%, so price gains are occurring alongside negative funding.
However, open interest has increased by just +0.1% over 24h, so the buildup of new leveraged positions is not strong. Don’t overestimate the hype.
If price pulls back to 0.0385 - 0.04032 and finds support, the bullish thesis remains valid; waiting for confirmation is preferable.
If volume pushes price above 0.04032, watch 0.04303 as the next upside level.
If price falls below the invalidation level of 0.03701, immediately admit the bullish view was wrong and don’t stay in the trade.
The conditions are all laid out. Reassess when a trigger occurs; don’t jump the gun.
The uncomfortable truth: 71% of accounts are long, so positioning is already crowded.
RSI at 78.1 is in overbought territory, and the reference risk/reward ratio is only 0.8—not particularly attractive.
The trend is bullish, sure, but chasing sentiment often means taking on the market’s downside risk.
For reference only; this is not investment advice. Contracts involve leverage, and investing carries risk.
This article was generated with the assistance of Elon Musk’s xAI large language model, Grok.
$SAPIEN #FuturesView