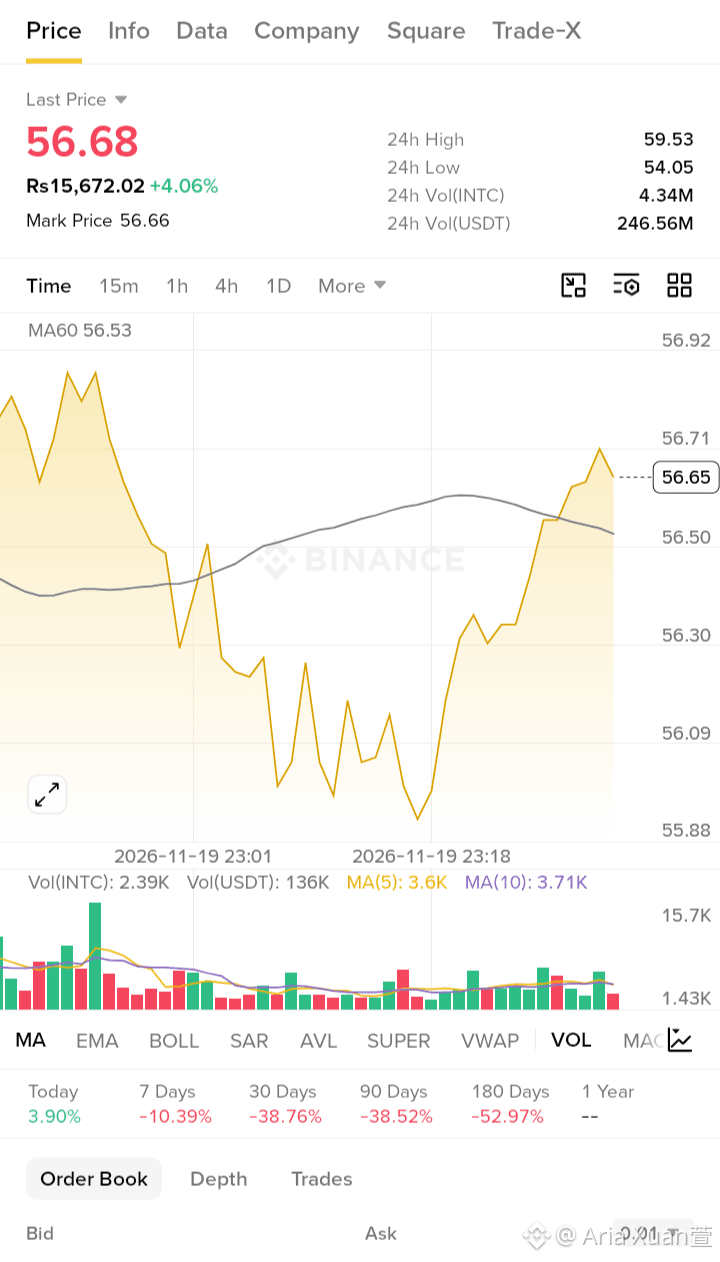
$INTC / USDT Market Update | Nov 19, 2026*
Last Price:* $56.68 (Rs 15,672.02) *+4.06%*
Mark Price:* $56.66
24H High:* $59.53
24H Low:* $54.05
24H Vol:* 4.34M INTC / 246.56M USDT
*Technical Analysis (15m):*
INTC with a STRONG bullish V-shape reversal!
After falling hard from $56.92 to $55.88 around 23:01, INTC formed a double bottom and then launched a massive rally all the way to $56.71 - almost $0.83 recovery. This is a perfect bullish reversal pattern.
Currently at *$56.65*, trading *ABOVE MA60 at $56.53*. MA60 was rising, then turned down, but price has now broken back above MA60 with strength. MA60 at $56.50 is now acting as support - bullish structure confirmed.
Volume: Vol(INTC) 2.39K Vol(USDT) 136K. MA(5) 3.6K vs MA(10) 3.71K - gap narrowing. Green volume increasing during the rally, especially last few candles show buyers in control. The volume spike at $56.92 top earlier was distribution, now accumulation.
Performance: Today +3.90% very strong, 7 Days -10.39% still in recovery, 30 Days -38.76%, 90 Days -38.52%, 180 Days -52.97% - INTC was in deep correction but today showing first sign of strong comeback.
*Key Levels:*
Support: $56.53 (MA60) / $56.30 / $55.88 (Intraday Low)
Resistance: $56.71 / $56.92 / $59.53 (24H High)
As long as INTC holds above $56.53 MA60, momentum remains bullish. A sustained move above $56.71 can push towards $56.92 and then $59.53.
Bullish reversal confirmed - uptrend in progress.
Not Financial Advice. DYOR.
#INTC #Intel #Stocks #Binance
Last Price:* $56.68 (Rs 15,672.02) *+4.06%*
Mark Price:* $56.66
24H High:* $59.53
24H Low:* $54.05
24H Vol:* 4.34M INTC / 246.56M USDT
*Technical Analysis (15m):*
INTC with a STRONG bullish V-shape reversal!
After falling hard from $56.92 to $55.88 around 23:01, INTC formed a double bottom and then launched a massive rally all the way to $56.71 - almost $0.83 recovery. This is a perfect bullish reversal pattern.
Currently at *$56.65*, trading *ABOVE MA60 at $56.53*. MA60 was rising, then turned down, but price has now broken back above MA60 with strength. MA60 at $56.50 is now acting as support - bullish structure confirmed.
Volume: Vol(INTC) 2.39K Vol(USDT) 136K. MA(5) 3.6K vs MA(10) 3.71K - gap narrowing. Green volume increasing during the rally, especially last few candles show buyers in control. The volume spike at $56.92 top earlier was distribution, now accumulation.
Performance: Today +3.90% very strong, 7 Days -10.39% still in recovery, 30 Days -38.76%, 90 Days -38.52%, 180 Days -52.97% - INTC was in deep correction but today showing first sign of strong comeback.
*Key Levels:*
Support: $56.53 (MA60) / $56.30 / $55.88 (Intraday Low)
Resistance: $56.71 / $56.92 / $59.53 (24H High)
As long as INTC holds above $56.53 MA60, momentum remains bullish. A sustained move above $56.71 can push towards $56.92 and then $59.53.
Bullish reversal confirmed - uptrend in progress.
Not Financial Advice. DYOR.
#INTC #Intel #Stocks #Binance