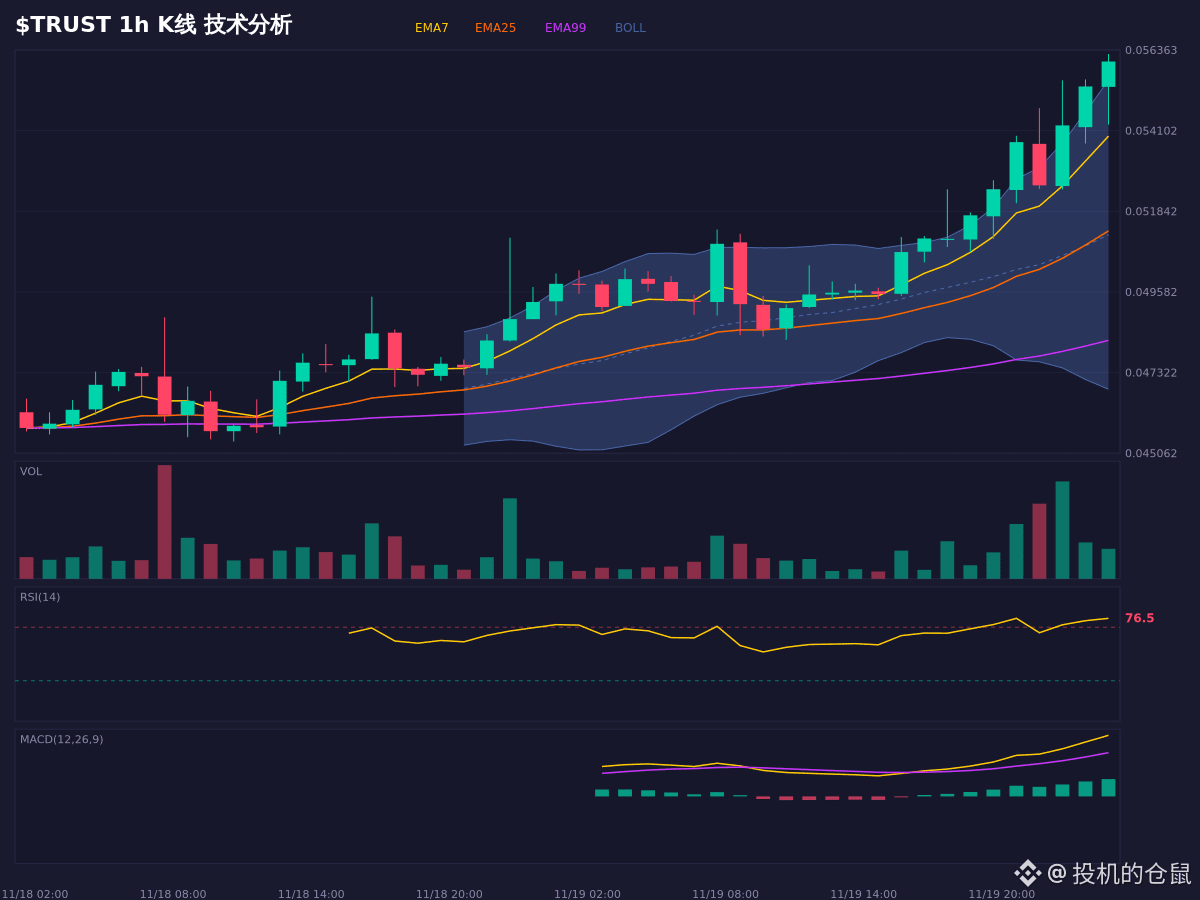
$TRUST The technical picture is somewhat contradictory: the moving averages are in a bullish alignment, but the RSI is overbought, so the risk of a short-term pullback is significant.
Support is in the 0.052–0.053 range, which coincides with the EMA25 and a Fibonacci retracement confluence level. OBV shows sustained capital inflows, with buyers in control, but the long/short ratio indicates that the share of long positions is declining as some traders take profits.
The expanding MACD histogram shows that bullish momentum remains strong. The price has broken above the upper Bollinger Band, but such extreme strength faces mean-reversion pressure. If support holds, the bullish structure is likely to continue; if the price falls below 0.0505, the thesis is invalidated.
For market observation and conditional scenario analysis only; this is not a record of trading activity.
$TRUST #合约 #牛市 #Bear market
Support is in the 0.052–0.053 range, which coincides with the EMA25 and a Fibonacci retracement confluence level. OBV shows sustained capital inflows, with buyers in control, but the long/short ratio indicates that the share of long positions is declining as some traders take profits.
The expanding MACD histogram shows that bullish momentum remains strong. The price has broken above the upper Bollinger Band, but such extreme strength faces mean-reversion pressure. If support holds, the bullish structure is likely to continue; if the price falls below 0.0505, the thesis is invalidated.
For market observation and conditional scenario analysis only; this is not a record of trading activity.
$TRUST #合约 #牛市 #Bear market