$ICP
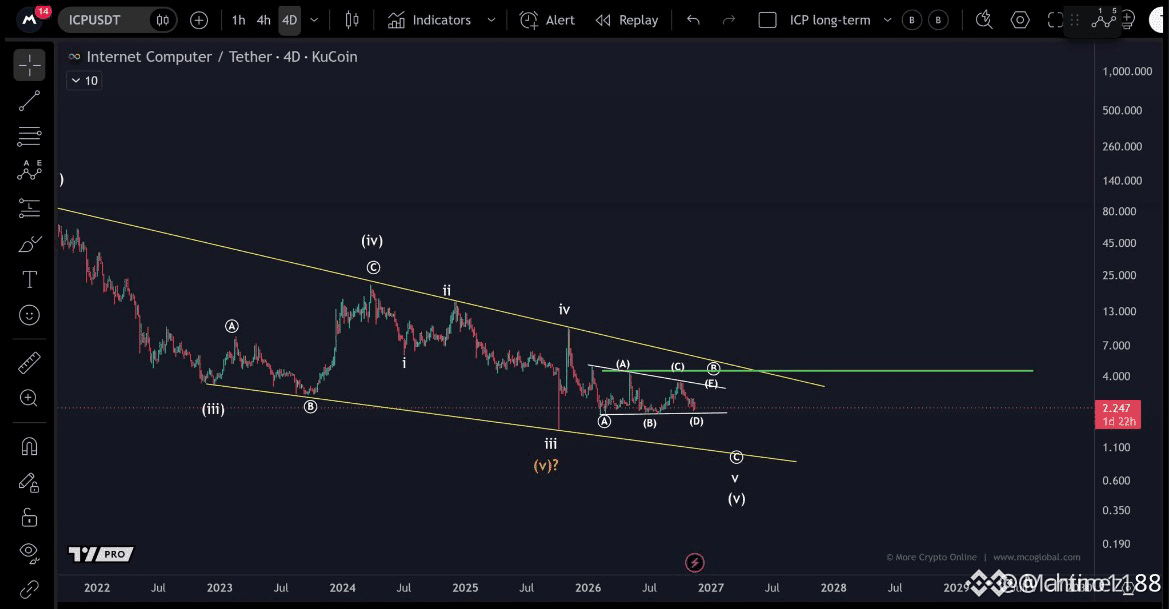
The chart is still in a downtrend, and for most of the year, the price has only moved sideways within a range. The fifth downward wave may be developing as an ABC structure, with wave B possibly being the triangle shown on the chart.
If the price falls below the recent lows in the $1.95 to $2 area, the downside breakout has probably begun. The lower line of the large wedge is the next major support level.
The chart is still in a downtrend, and for most of the year, the price has only moved sideways within a range. The fifth downward wave may be developing as an ABC structure, with wave B possibly being the triangle shown on the chart.
If the price falls below the recent lows in the $1.95 to $2 area, the downside breakout has probably begun. The lower line of the large wedge is the next major support level.