$FET / $STRK / $LTC 24-hour weakening, under short-term pressure 🔥
════════════════════
🟢 $FET 4-hour bearish signal
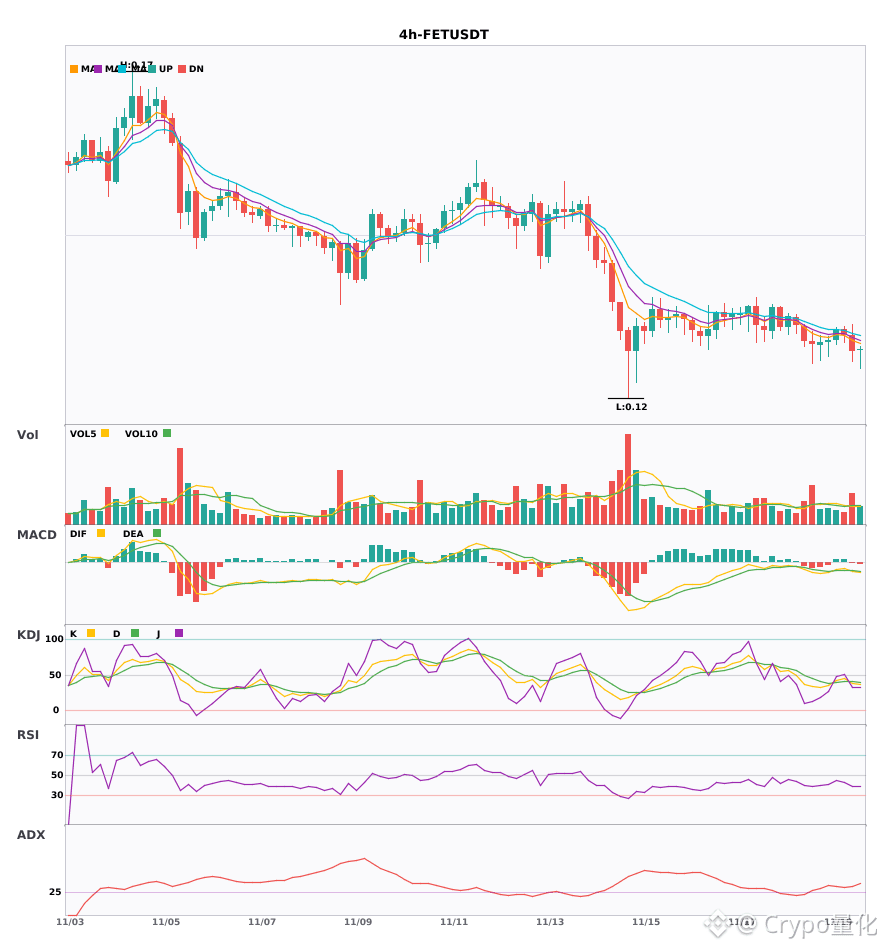
⚠️Technical analysis: ADX is at 32, indicating a fairly clear trend. MACD has formed a bearish cross below zero, with bearish momentum accelerating. The moving averages are bearishly aligned and trending downward. KDJ has formed a bearish cross, with K at 37.8 and D at 40.3, indicating a short-term bearish bias. Trading volume is up 1.6x.
════════════════════
🟢 $STRK 4-hour bearish signal
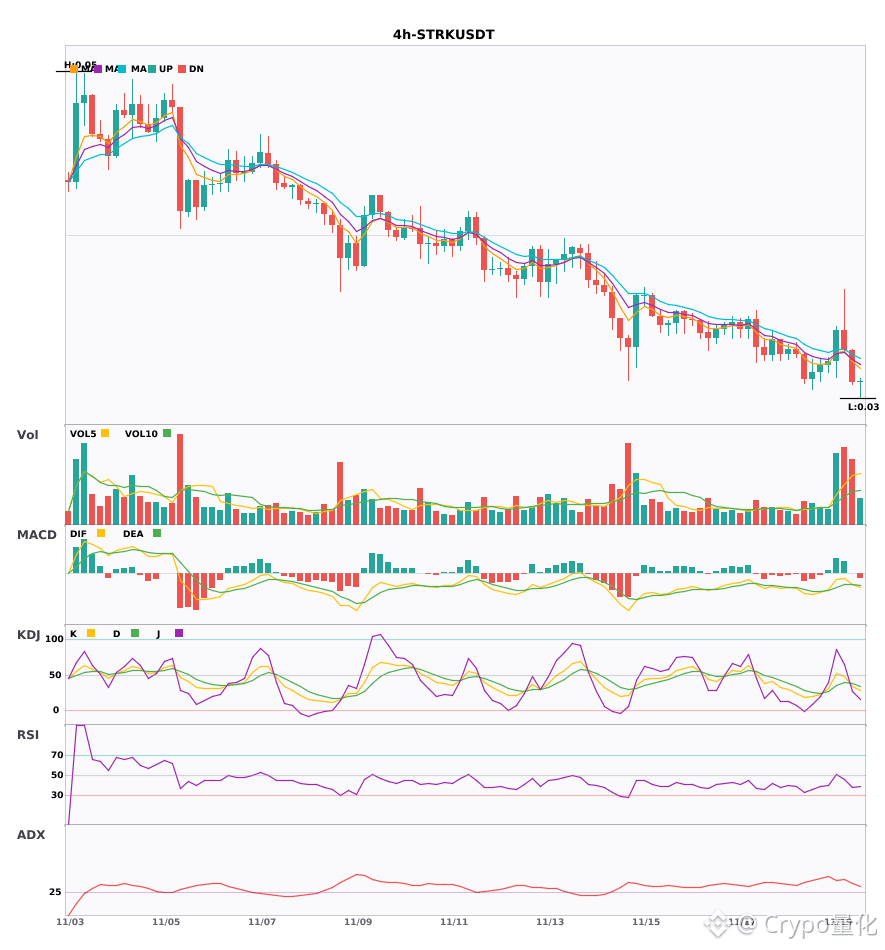
⚠️Technical analysis: The trend is clear. MACD has formed a bearish cross below zero, with bears gaining strength. EMA5 has crossed below EMA8, turning bearish. KDJ has formed a bearish cross, indicating a downward outlook. Volume is up 2.7x.
════════════════════
🟢 $LTC 4-hour bearish signal
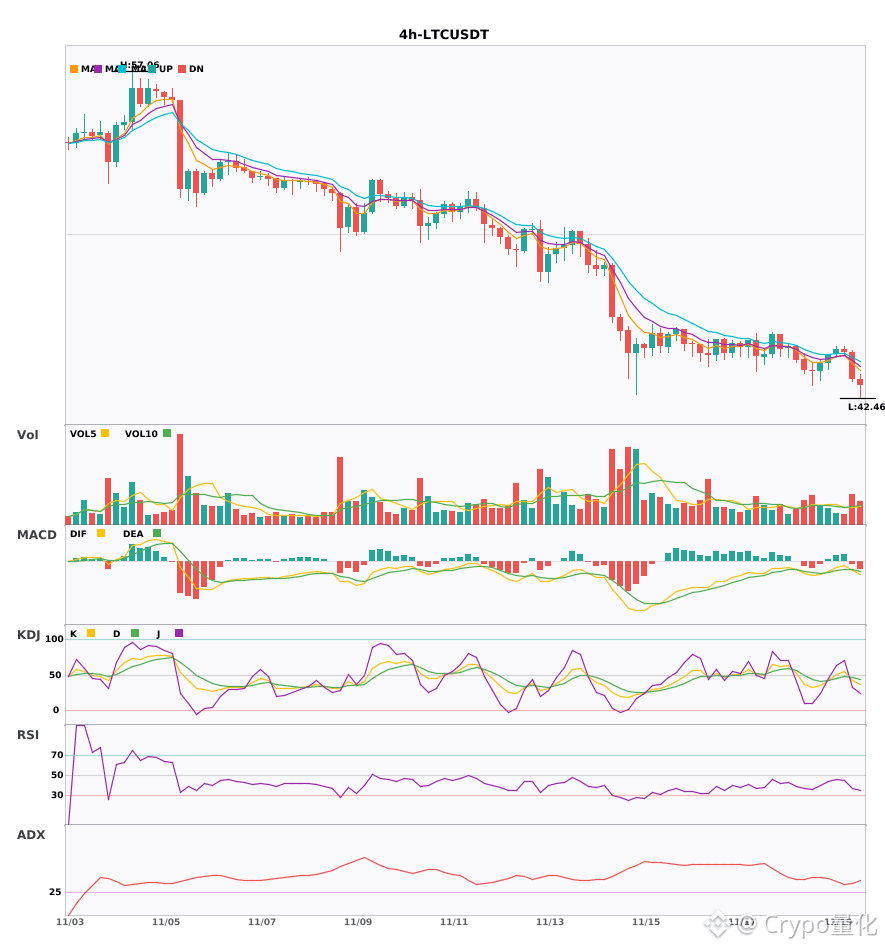
⚠️Technical analysis: ADX is at 31, indicating a strong trend. MACD has formed a bearish cross below zero, with bearish momentum accelerating. EMA5 has crossed below EMA8, turning bearish in the short term. KDJ has formed a bearish cross (K at 41.9, D at 46.2), indicating a bearish outlook. Volume is up 1.6x.
════════════════════
🔔 Follow to get the latest market movements 🔔
#技术分析 #FET #STRK #LTC
📌 When trading, watch for whether the candlestick patterns confirm the signal
════════════════════
🟢 $FET 4-hour bearish signal
⚠️Technical analysis: ADX is at 32, indicating a fairly clear trend. MACD has formed a bearish cross below zero, with bearish momentum accelerating. The moving averages are bearishly aligned and trending downward. KDJ has formed a bearish cross, with K at 37.8 and D at 40.3, indicating a short-term bearish bias. Trading volume is up 1.6x.
════════════════════
🟢 $STRK 4-hour bearish signal
⚠️Technical analysis: The trend is clear. MACD has formed a bearish cross below zero, with bears gaining strength. EMA5 has crossed below EMA8, turning bearish. KDJ has formed a bearish cross, indicating a downward outlook. Volume is up 2.7x.
════════════════════
🟢 $LTC 4-hour bearish signal
⚠️Technical analysis: ADX is at 31, indicating a strong trend. MACD has formed a bearish cross below zero, with bearish momentum accelerating. EMA5 has crossed below EMA8, turning bearish in the short term. KDJ has formed a bearish cross (K at 41.9, D at 46.2), indicating a bearish outlook. Volume is up 1.6x.
════════════════════
🔔 Follow to get the latest market movements 🔔
#技术分析 #FET #STRK #LTC
📌 When trading, watch for whether the candlestick patterns confirm the signal