Bitcoin BTC/USDT analysis | Is the price preparing for a new breakout# or a sudden drop? 📊
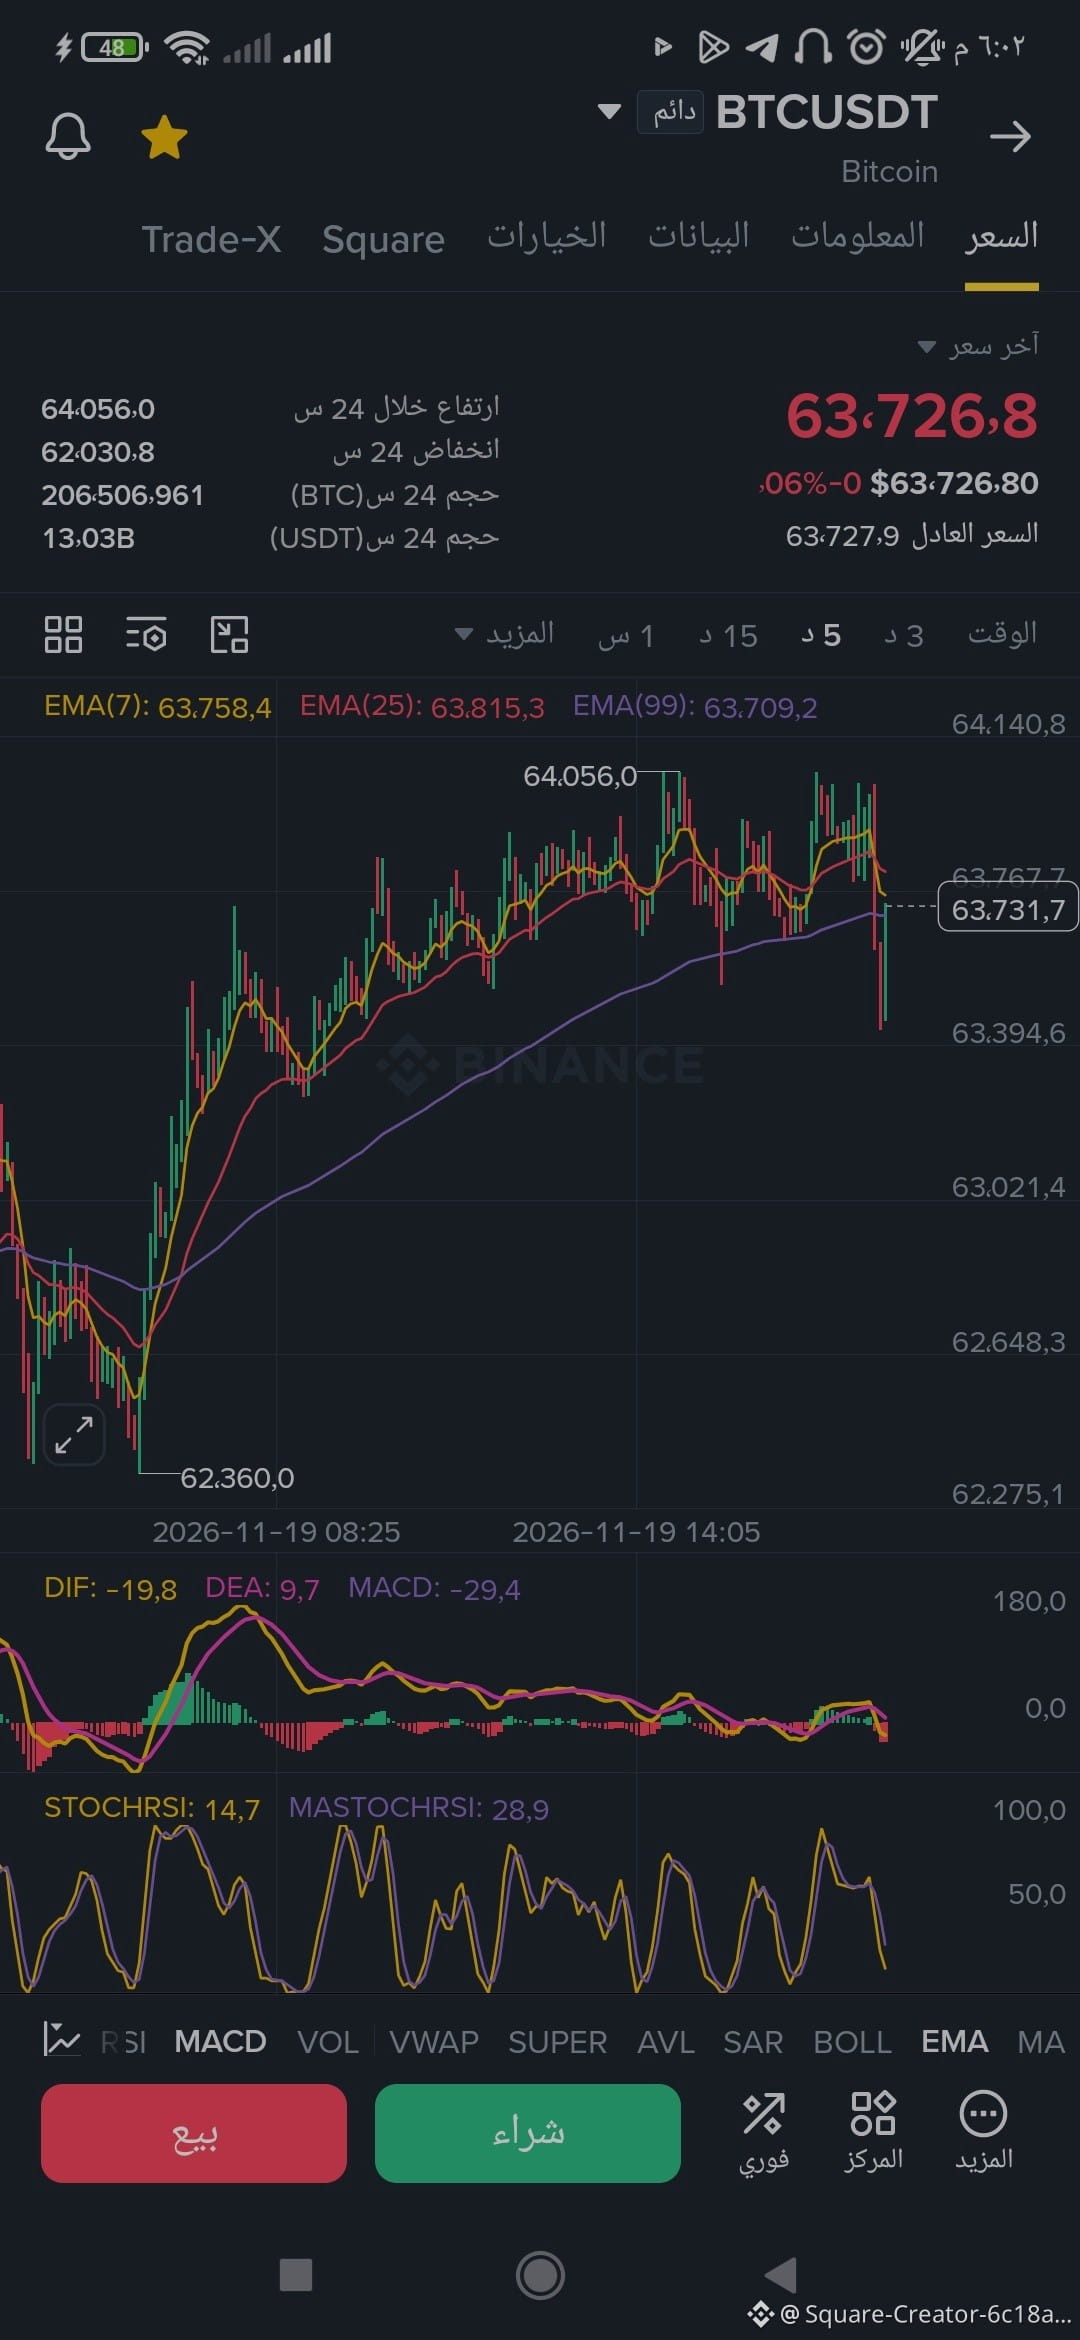
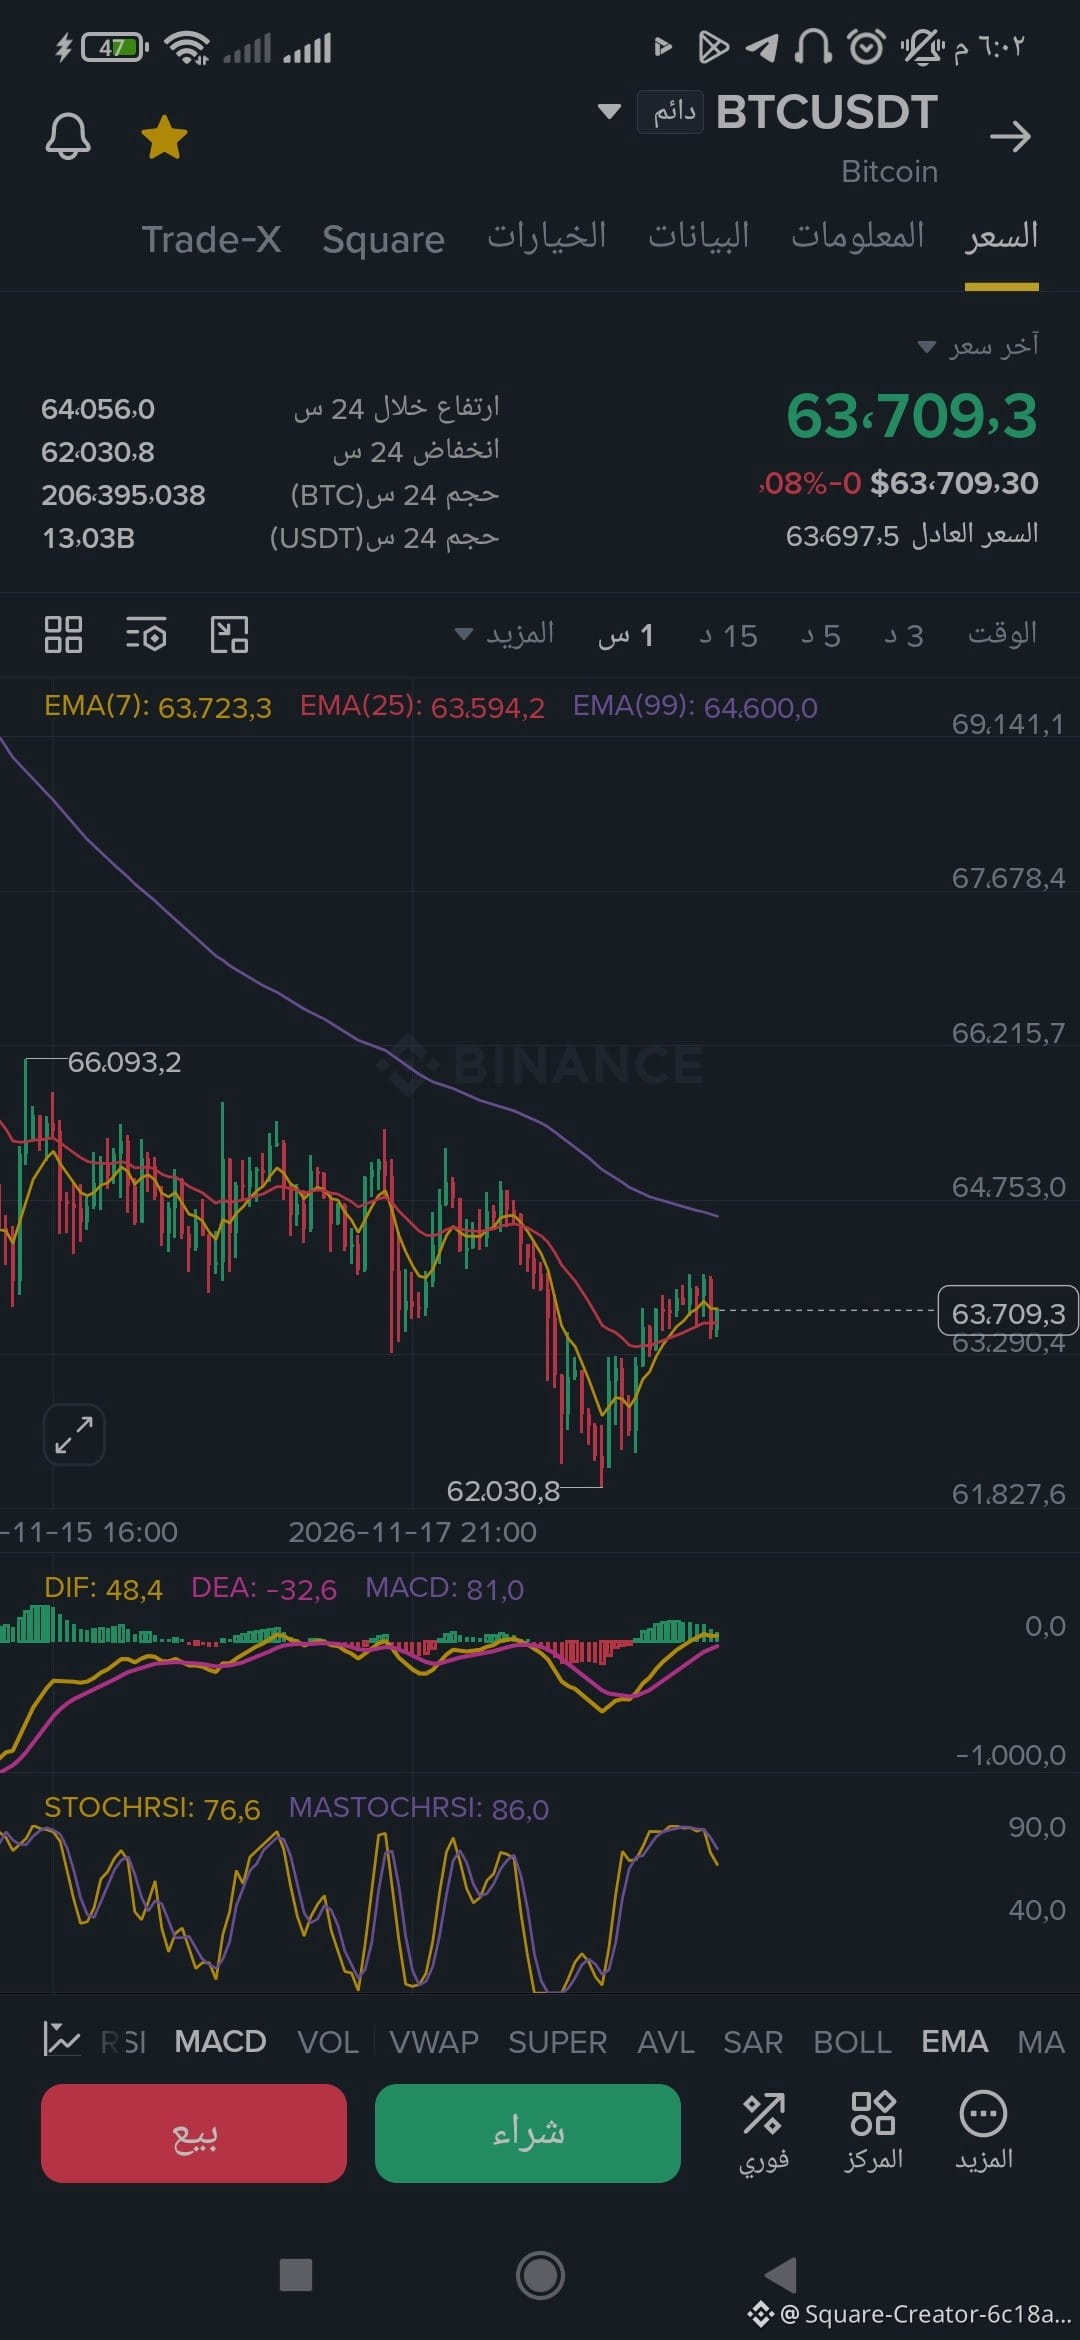
By watching the chart on the 1-hour and 5-minute timeframes, we can see that Bitcoin is trading near $63,700, and there are technical signals worth paying attention to.
📈 Technical analysis:
🔹 1-hour timeframe:
The price is trying to hold above the EMA25 at $63,594.
The EMA99 at $64,600 represents significant resistance.
The MACD indicator is positive, but upward momentum has started to weaken.
The Stoch RSI has reached elevated levels, making a correction possible.
🔹 5-minute timeframe:
The price is trading below the EMA7 and EMA25, indicating short-term weakness.
The MACD indicator is negative.
The Stoch RSI is in a low zone, and we may see a temporary rebound.
First support: $63,394
Stronger support: $63,030
💡 Expected scenario:
A break above $63,815 and holding above it could support an attempt to rise toward $64,056, while a break below $63,394 could open the door to testing lower levels.
⚠️ This is an educational technical analysis, not a buy or sell recommendation. You should wait for confirmation of the move before making any decisions.
❤️ And now I’d love to hear your thoughts, friends:
Do you expect Bitcoin to break through the $64,000 mark soon 🚀, or will we see a drop to $63,000? 📉
Share your predictions in the comments, and don’t forget to support the post with a like and a share so everyone can benefit ❤️$BTC
By watching the chart on the 1-hour and 5-minute timeframes, we can see that Bitcoin is trading near $63,700, and there are technical signals worth paying attention to.
📈 Technical analysis:
🔹 1-hour timeframe:
The price is trying to hold above the EMA25 at $63,594.
The EMA99 at $64,600 represents significant resistance.
The MACD indicator is positive, but upward momentum has started to weaken.
The Stoch RSI has reached elevated levels, making a correction possible.
🔹 5-minute timeframe:
The price is trading below the EMA7 and EMA25, indicating short-term weakness.
The MACD indicator is negative.
The Stoch RSI is in a low zone, and we may see a temporary rebound.
First support: $63,394
Stronger support: $63,030
💡 Expected scenario:
A break above $63,815 and holding above it could support an attempt to rise toward $64,056, while a break below $63,394 could open the door to testing lower levels.
⚠️ This is an educational technical analysis, not a buy or sell recommendation. You should wait for confirmation of the move before making any decisions.
❤️ And now I’d love to hear your thoughts, friends:
Do you expect Bitcoin to break through the $64,000 mark soon 🚀, or will we see a drop to $63,000? 📉
Share your predictions in the comments, and don’t forget to support the post with a like and a share so everyone can benefit ❤️$BTC