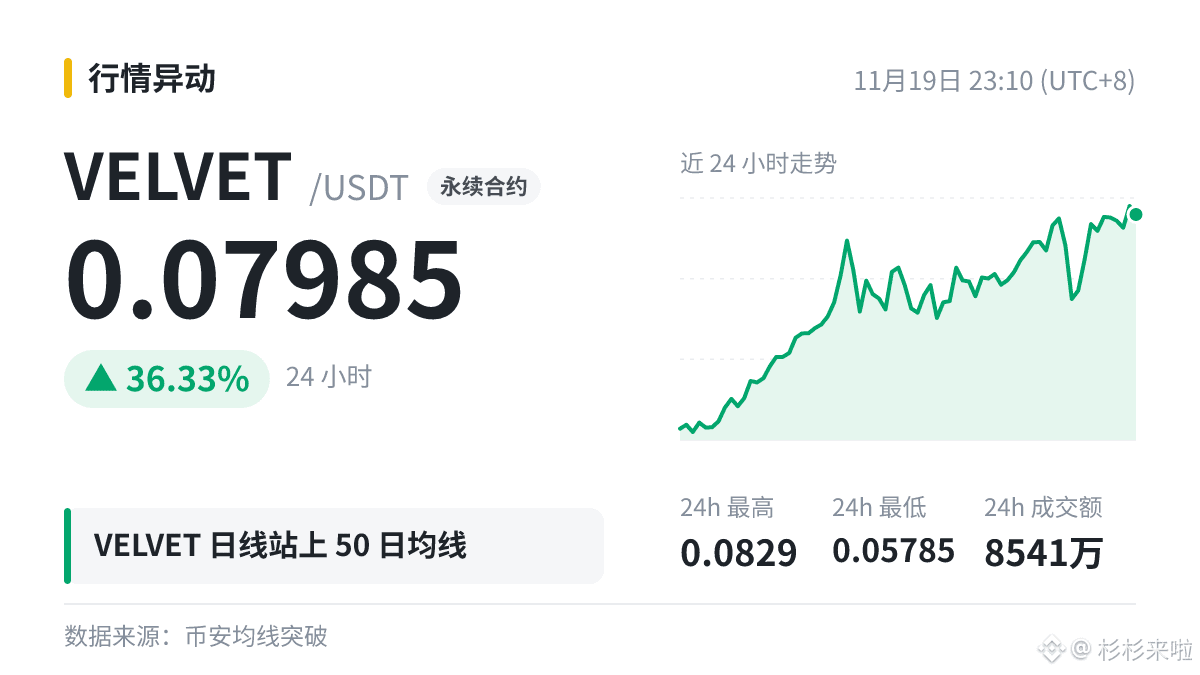
$VELVET The daily chart is above MA50 (0.06121), up 36.33% in 24h.
Let's use this number to talk about moving averages.
A moving average is the average closing price of the past N candlesticks. Each time a new candlestick closes, the calculation moves forward by one candle; connecting the values forms the moving average line.
The same moving average can play different roles for different coins: the more actively traded a coin is and the more people watching it, the more pronounced the fluctuations near its moving average tend to be.
Extreme readings often come with more intense volatility. At times like these, it's better to reduce your position rather than add to it.
#VELVET
Let's use this number to talk about moving averages.
A moving average is the average closing price of the past N candlesticks. Each time a new candlestick closes, the calculation moves forward by one candle; connecting the values forms the moving average line.
The same moving average can play different roles for different coins: the more actively traded a coin is and the more people watching it, the more pronounced the fluctuations near its moving average tend to be.
Extreme readings often come with more intense volatility. At times like these, it's better to reduce your position rather than add to it.
#VELVET