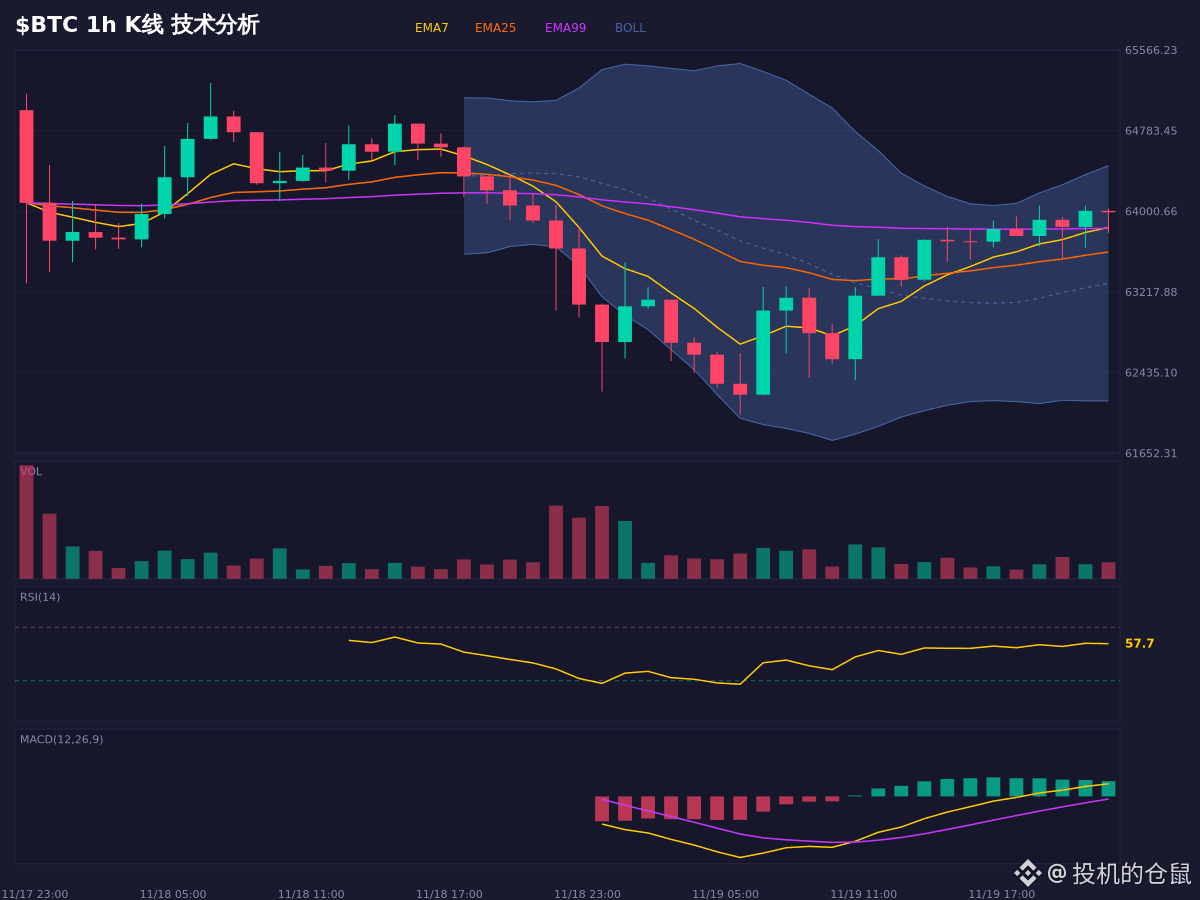
$BTC is currently at 63874. The short-term moving averages are clearly bullish, with EMA7 almost hugging the price. But EMA99 is still overhead on the mid-term chart, indicating this is still just a short-term rebound.
Wow, Stoch RSI has shot straight up to 93.7—that's seriously overbought, and the short-term pullback pressure is considerable. Looking at the long/short ratio, it's still 1.88, but the share of long positions is declining, so it's clear some people are starting to exit.
The OBV signal of capital outflows is also worth watching out for. Could this rally be a bull trap?
If the price can hold steady around 63282, the bullish structure may continue. But if it breaks below 62574, the current thesis is completely invalidated. Chasing the price here is risky; it looks like the market may move sideways.
For market observation and conditional analysis only; this is not a record of trading activity.
$BTC #行情分析 #现货 #合约
Wow, Stoch RSI has shot straight up to 93.7—that's seriously overbought, and the short-term pullback pressure is considerable. Looking at the long/short ratio, it's still 1.88, but the share of long positions is declining, so it's clear some people are starting to exit.
The OBV signal of capital outflows is also worth watching out for. Could this rally be a bull trap?
If the price can hold steady around 63282, the bullish structure may continue. But if it breaks below 62574, the current thesis is completely invalidated. Chasing the price here is risky; it looks like the market may move sideways.
For market observation and conditional analysis only; this is not a record of trading activity.
$BTC #行情分析 #现货 #合约