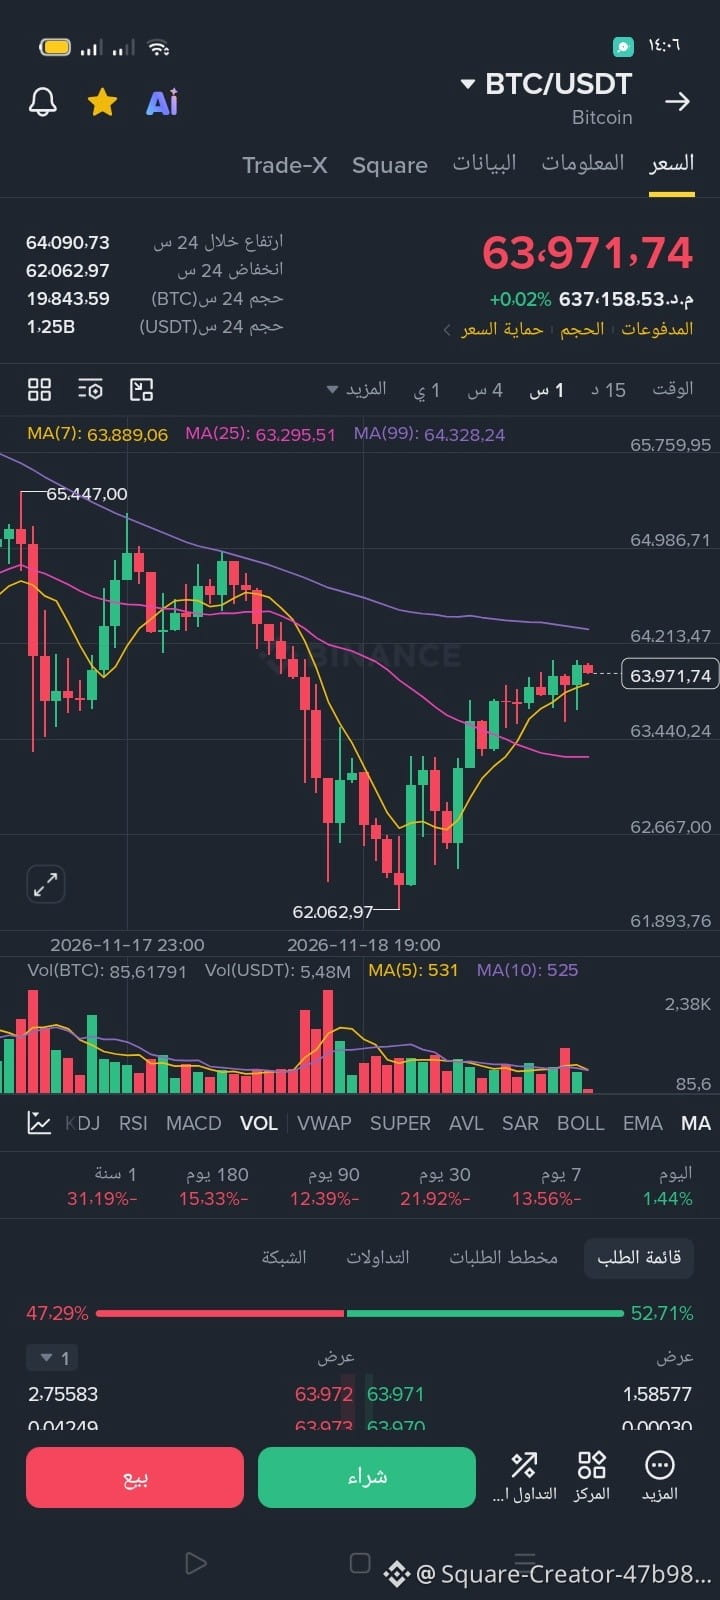
$BTC 💰 Current price: 63,971.74 USDT
🟢 24-hour change: +0.02%
📈 High: 64,090.73
📉 Low: 62,062.97
🔍 Price movement analysis
Bitcoin fell from the $65,447 area to a low of $62,062, before beginning a gradual upward rebound. The price is currently trading near $63,972, attempting to reclaim resistance levels, with short-term candlestick movement improving.
$BTC 📈 Technical indicators
MA7: 63,889 – The price is slightly above it, supporting a short-term rebound.
MA25: 63,295 – The price is above it, indicating improving momentum.
MA99: 64,328 – This represents nearby resistance that may limit further gains.
🟢 Short-term momentum: Cautiously positive.
🔴 Overall trend: A break above resistance is still needed to confirm a bullish reversal.
🟢 Support zones
63,400 – 63,250 First support.
62,900 – 62,650 Second support.
62,060 Major support and previous low.
🔴 Resistance zones
64,200 – 64,350 First resistance.
64,500 – 64,990 Second resistance.
65,400 – 65,750 Strong resistance.
🎯 Possible scenarios
Bullish: A break above 64,350 and holding above it could push the price toward 64,500, then 64,990.
Bearish: Failure to break above 64,200–64,350 could lead to a decline toward 63,400, then 63,250.
A break below 63,250 could bring selling pressure back toward 62,900, then 62,650.$BTC
#BTC #Binance #USDT #USDC
🟢 24-hour change: +0.02%
📈 High: 64,090.73
📉 Low: 62,062.97
🔍 Price movement analysis
Bitcoin fell from the $65,447 area to a low of $62,062, before beginning a gradual upward rebound. The price is currently trading near $63,972, attempting to reclaim resistance levels, with short-term candlestick movement improving.
$BTC 📈 Technical indicators
MA7: 63,889 – The price is slightly above it, supporting a short-term rebound.
MA25: 63,295 – The price is above it, indicating improving momentum.
MA99: 64,328 – This represents nearby resistance that may limit further gains.
🟢 Short-term momentum: Cautiously positive.
🔴 Overall trend: A break above resistance is still needed to confirm a bullish reversal.
🟢 Support zones
63,400 – 63,250 First support.
62,900 – 62,650 Second support.
62,060 Major support and previous low.
🔴 Resistance zones
64,200 – 64,350 First resistance.
64,500 – 64,990 Second resistance.
65,400 – 65,750 Strong resistance.
🎯 Possible scenarios
Bullish: A break above 64,350 and holding above it could push the price toward 64,500, then 64,990.
Bearish: Failure to break above 64,200–64,350 could lead to a decline toward 63,400, then 63,250.
A break below 63,250 could bring selling pressure back toward 62,900, then 62,650.$BTC
#BTC #Binance #USDT #USDC