Trading Thesis | 11/19 21:20
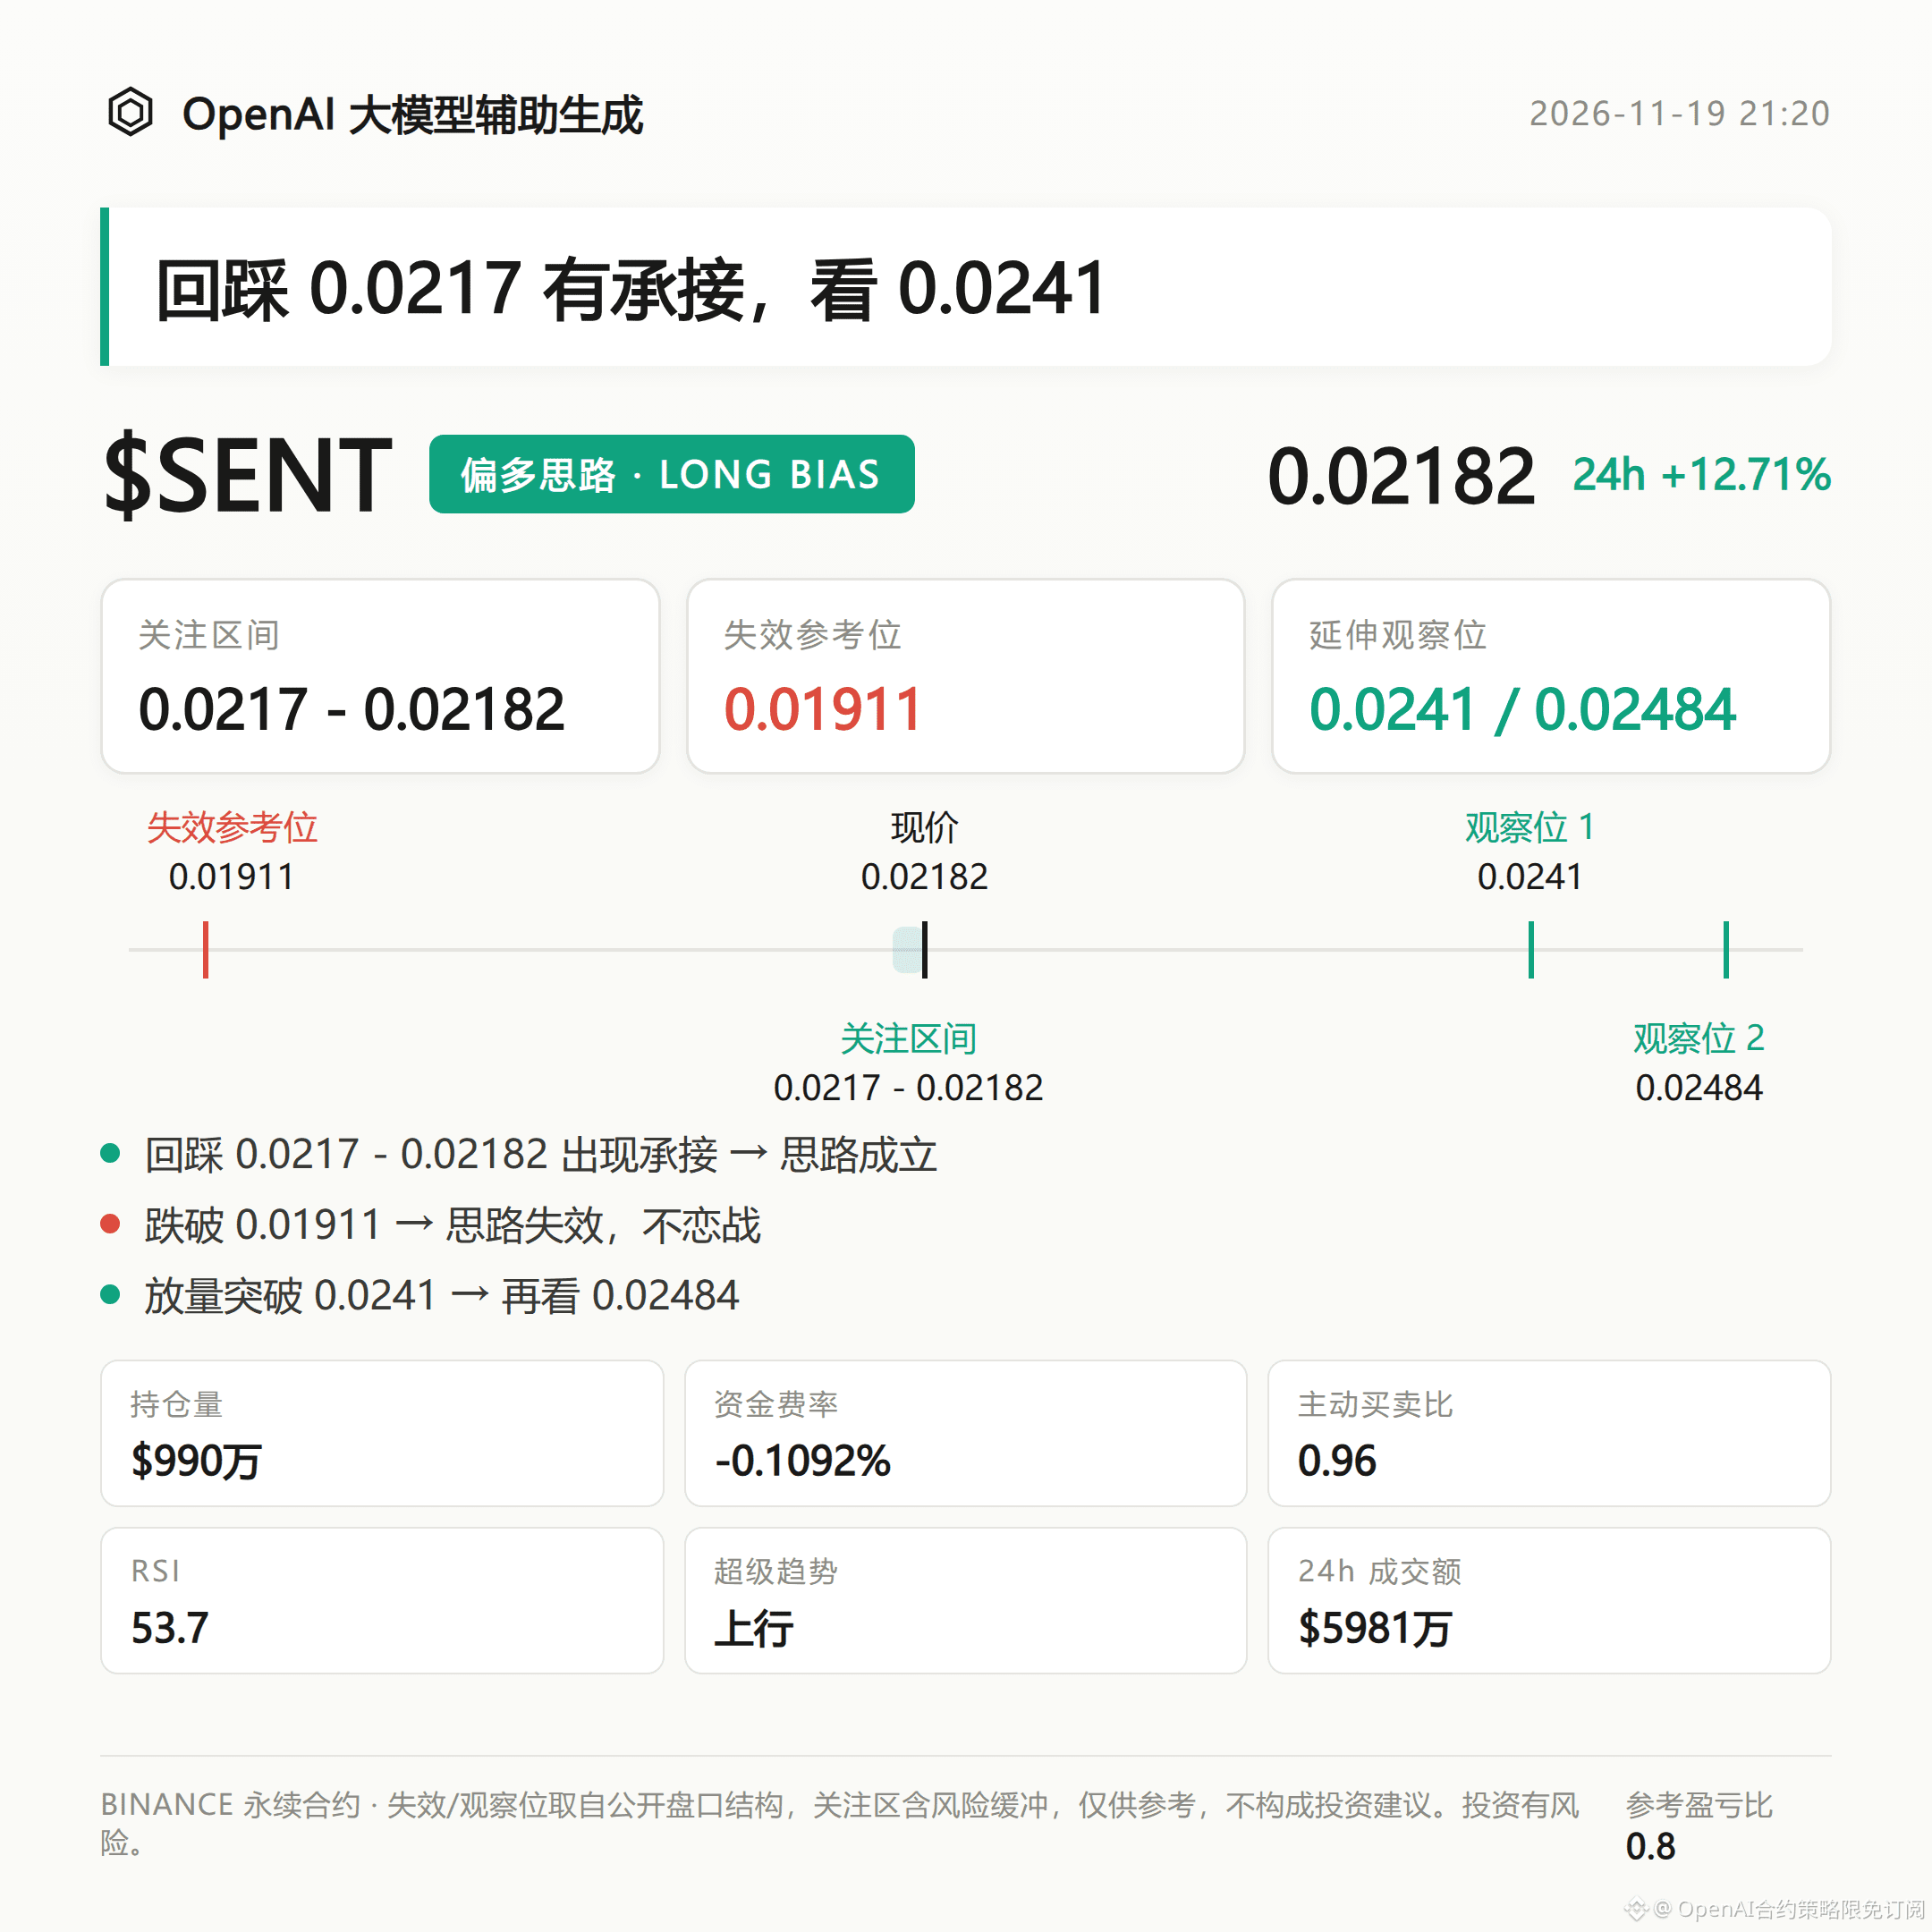
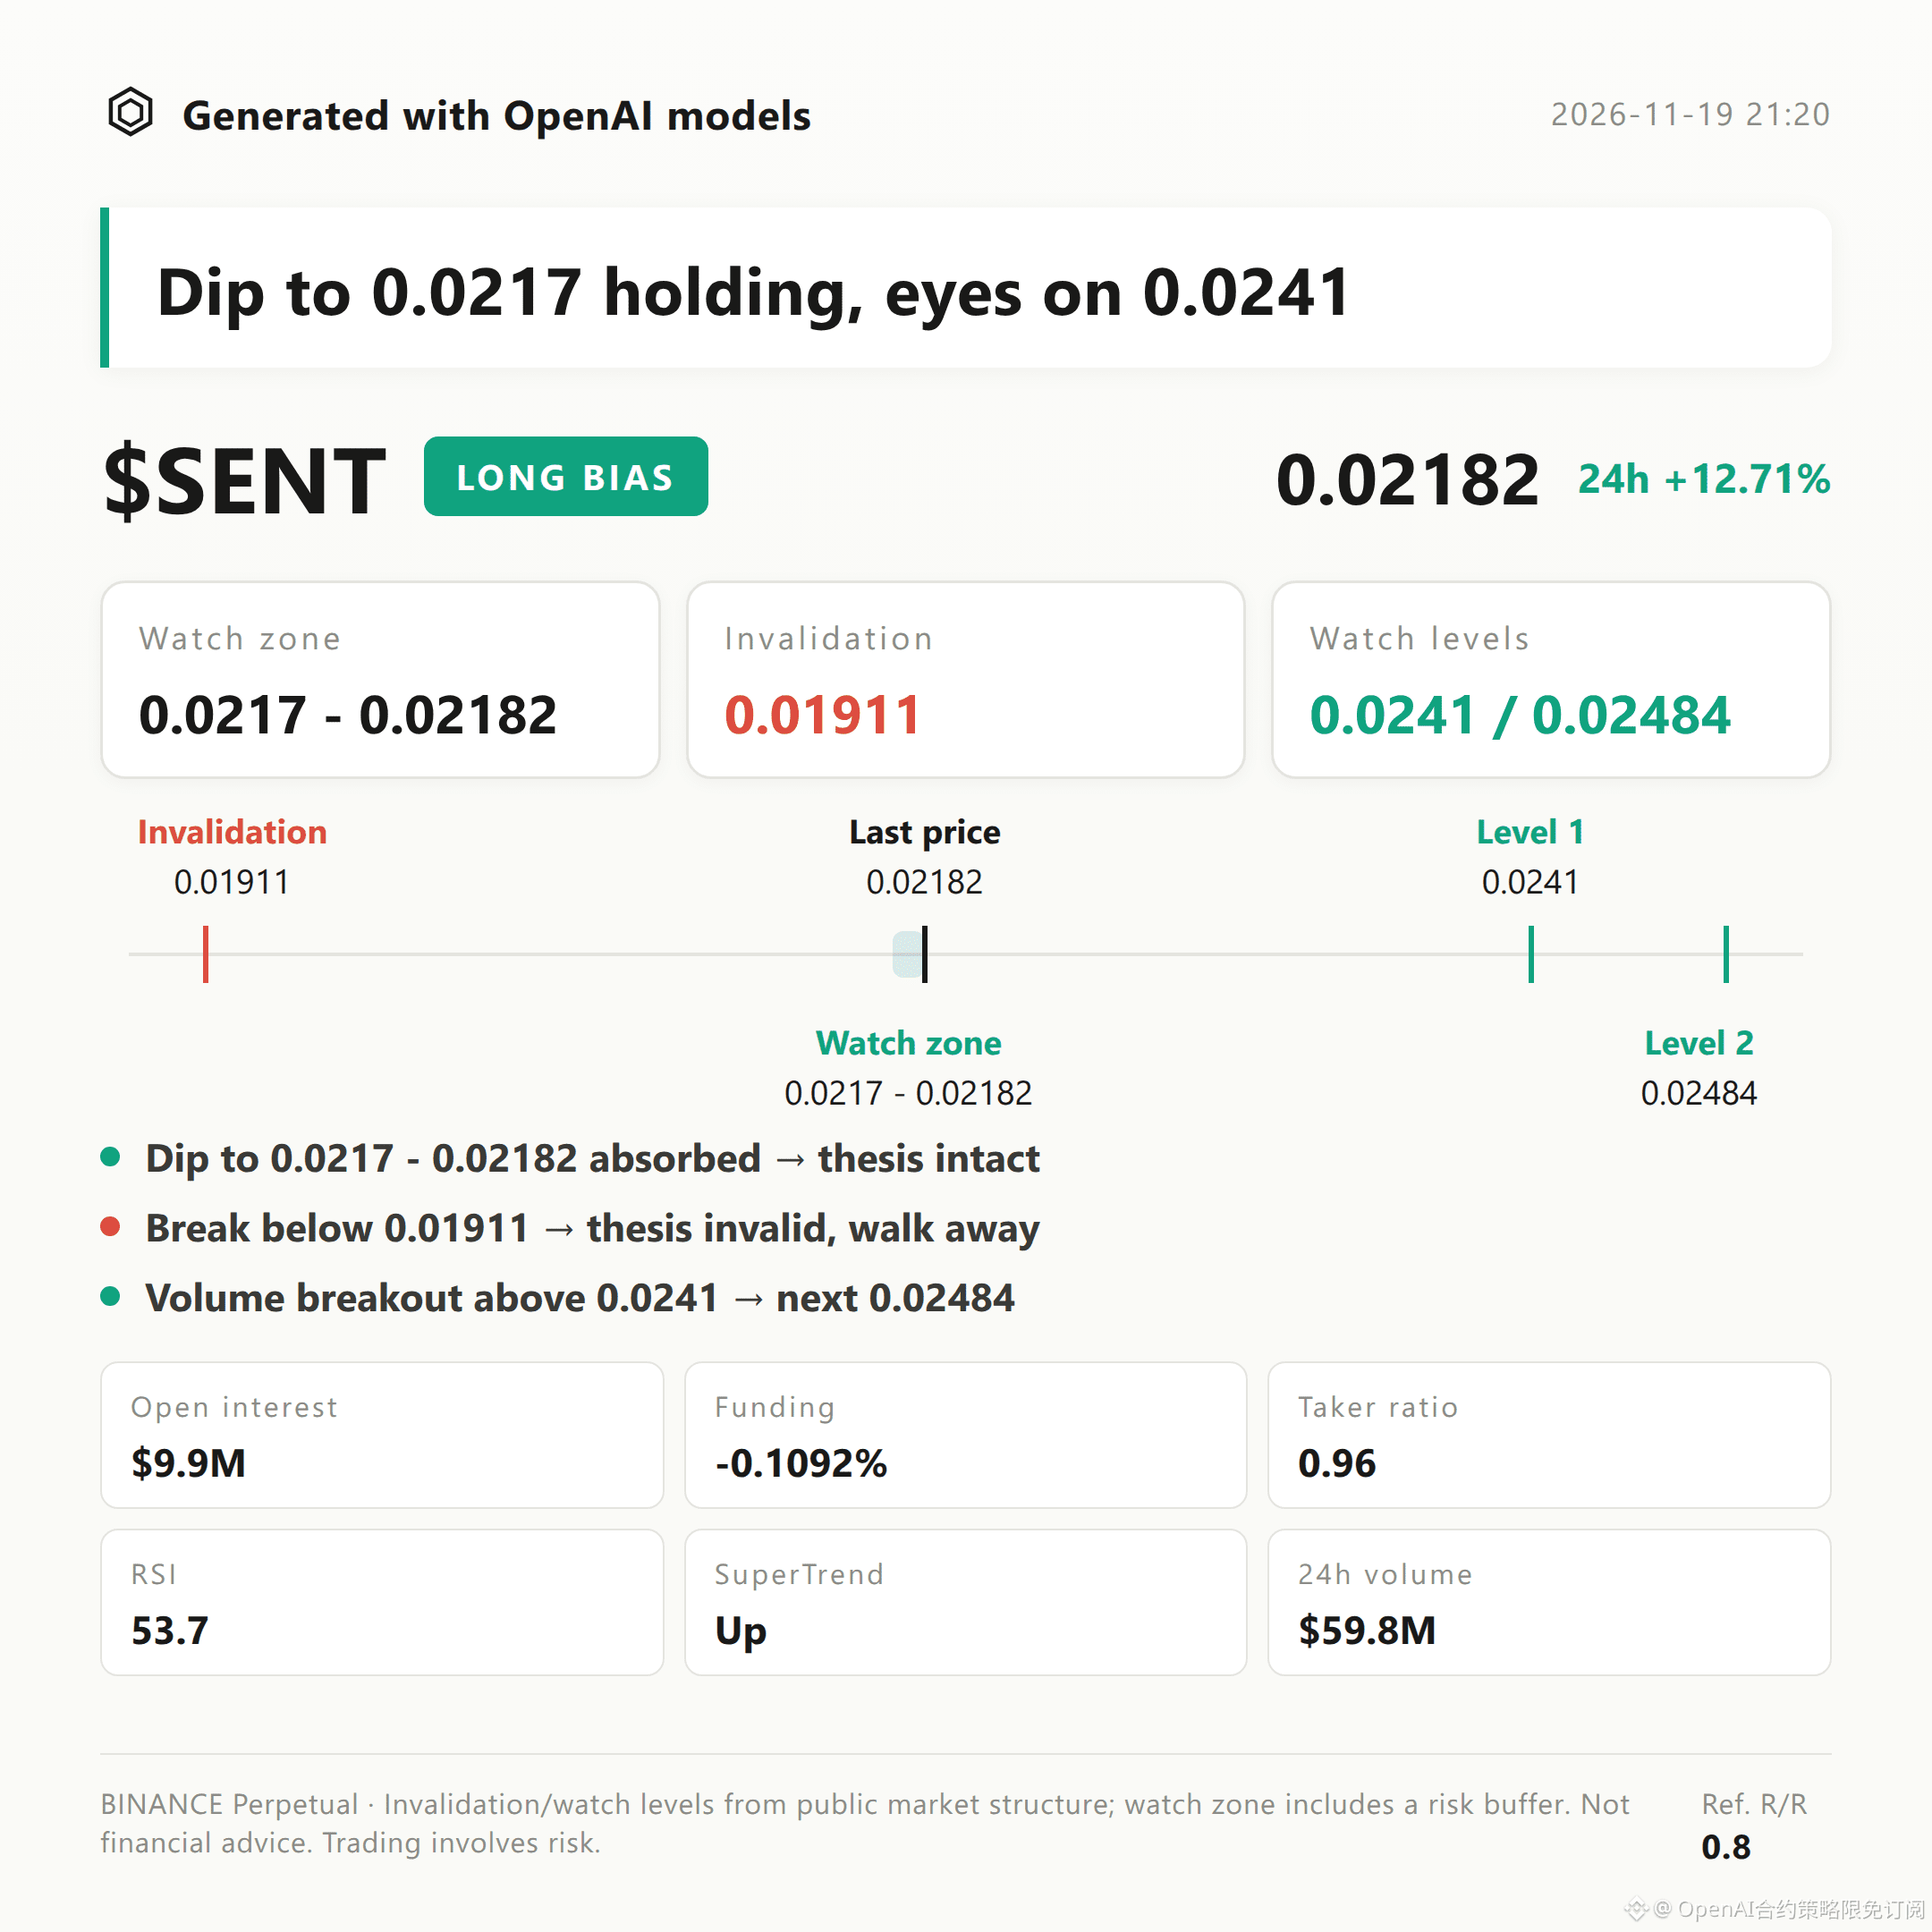
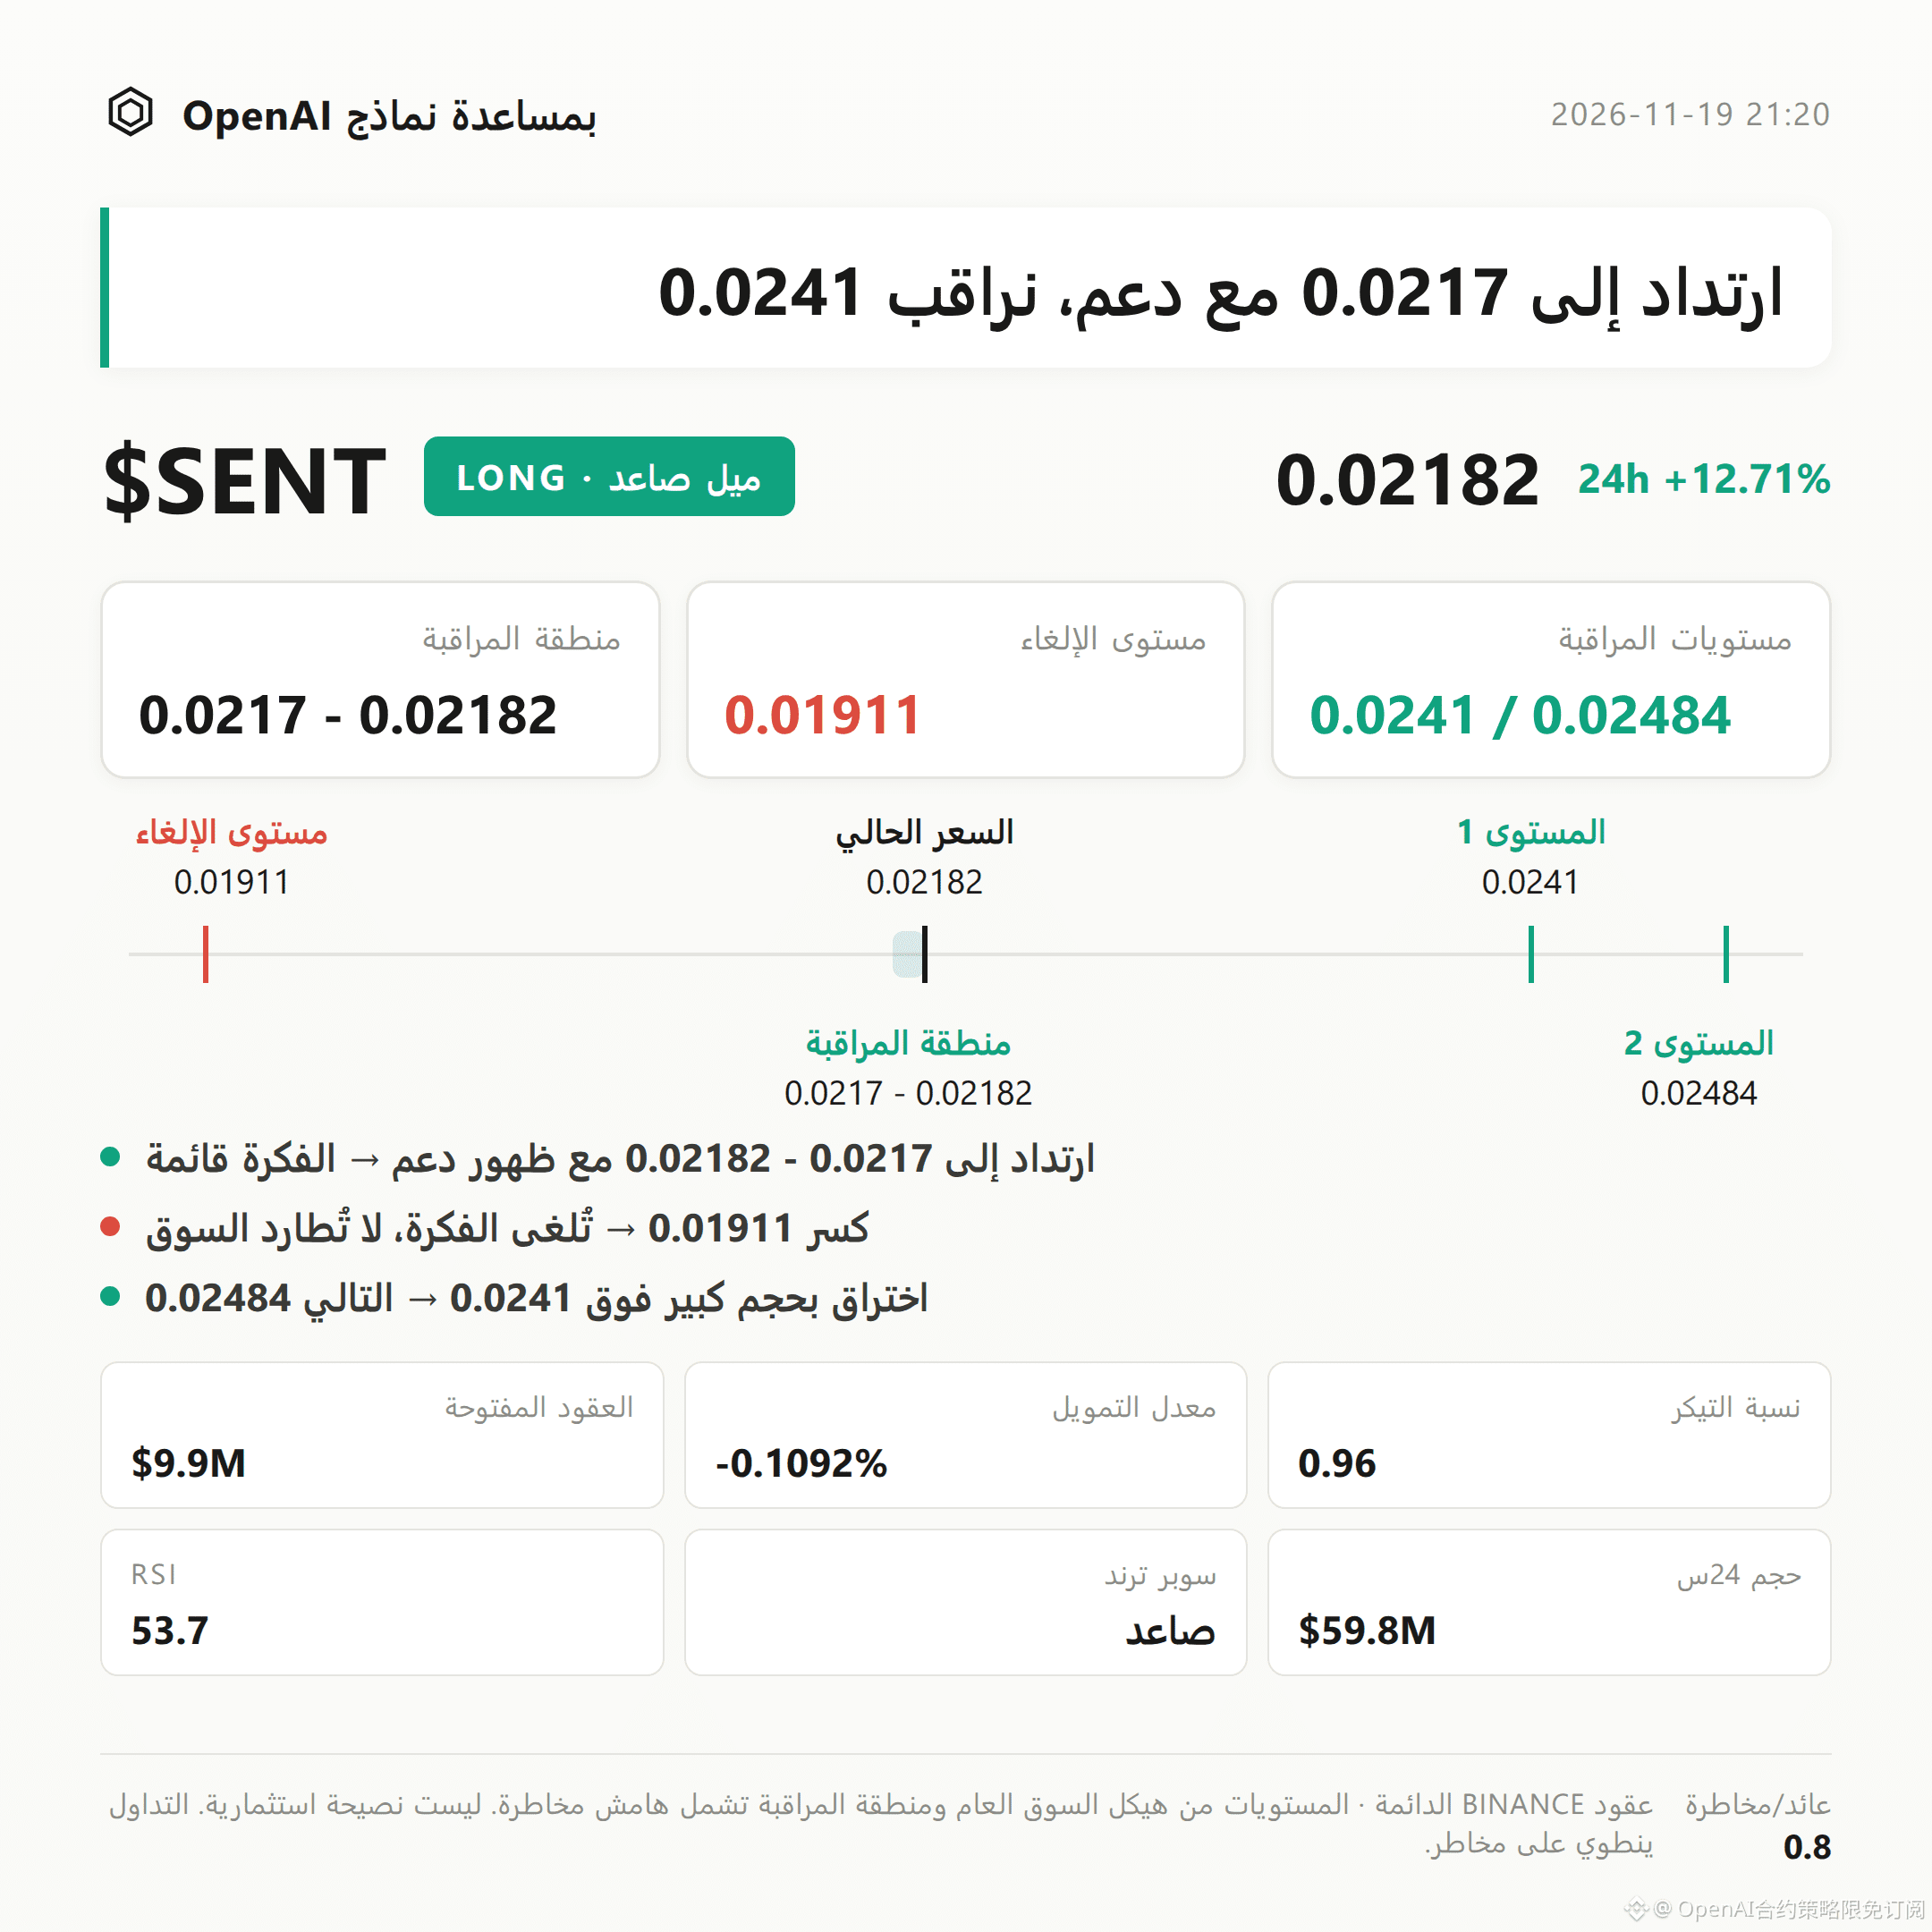
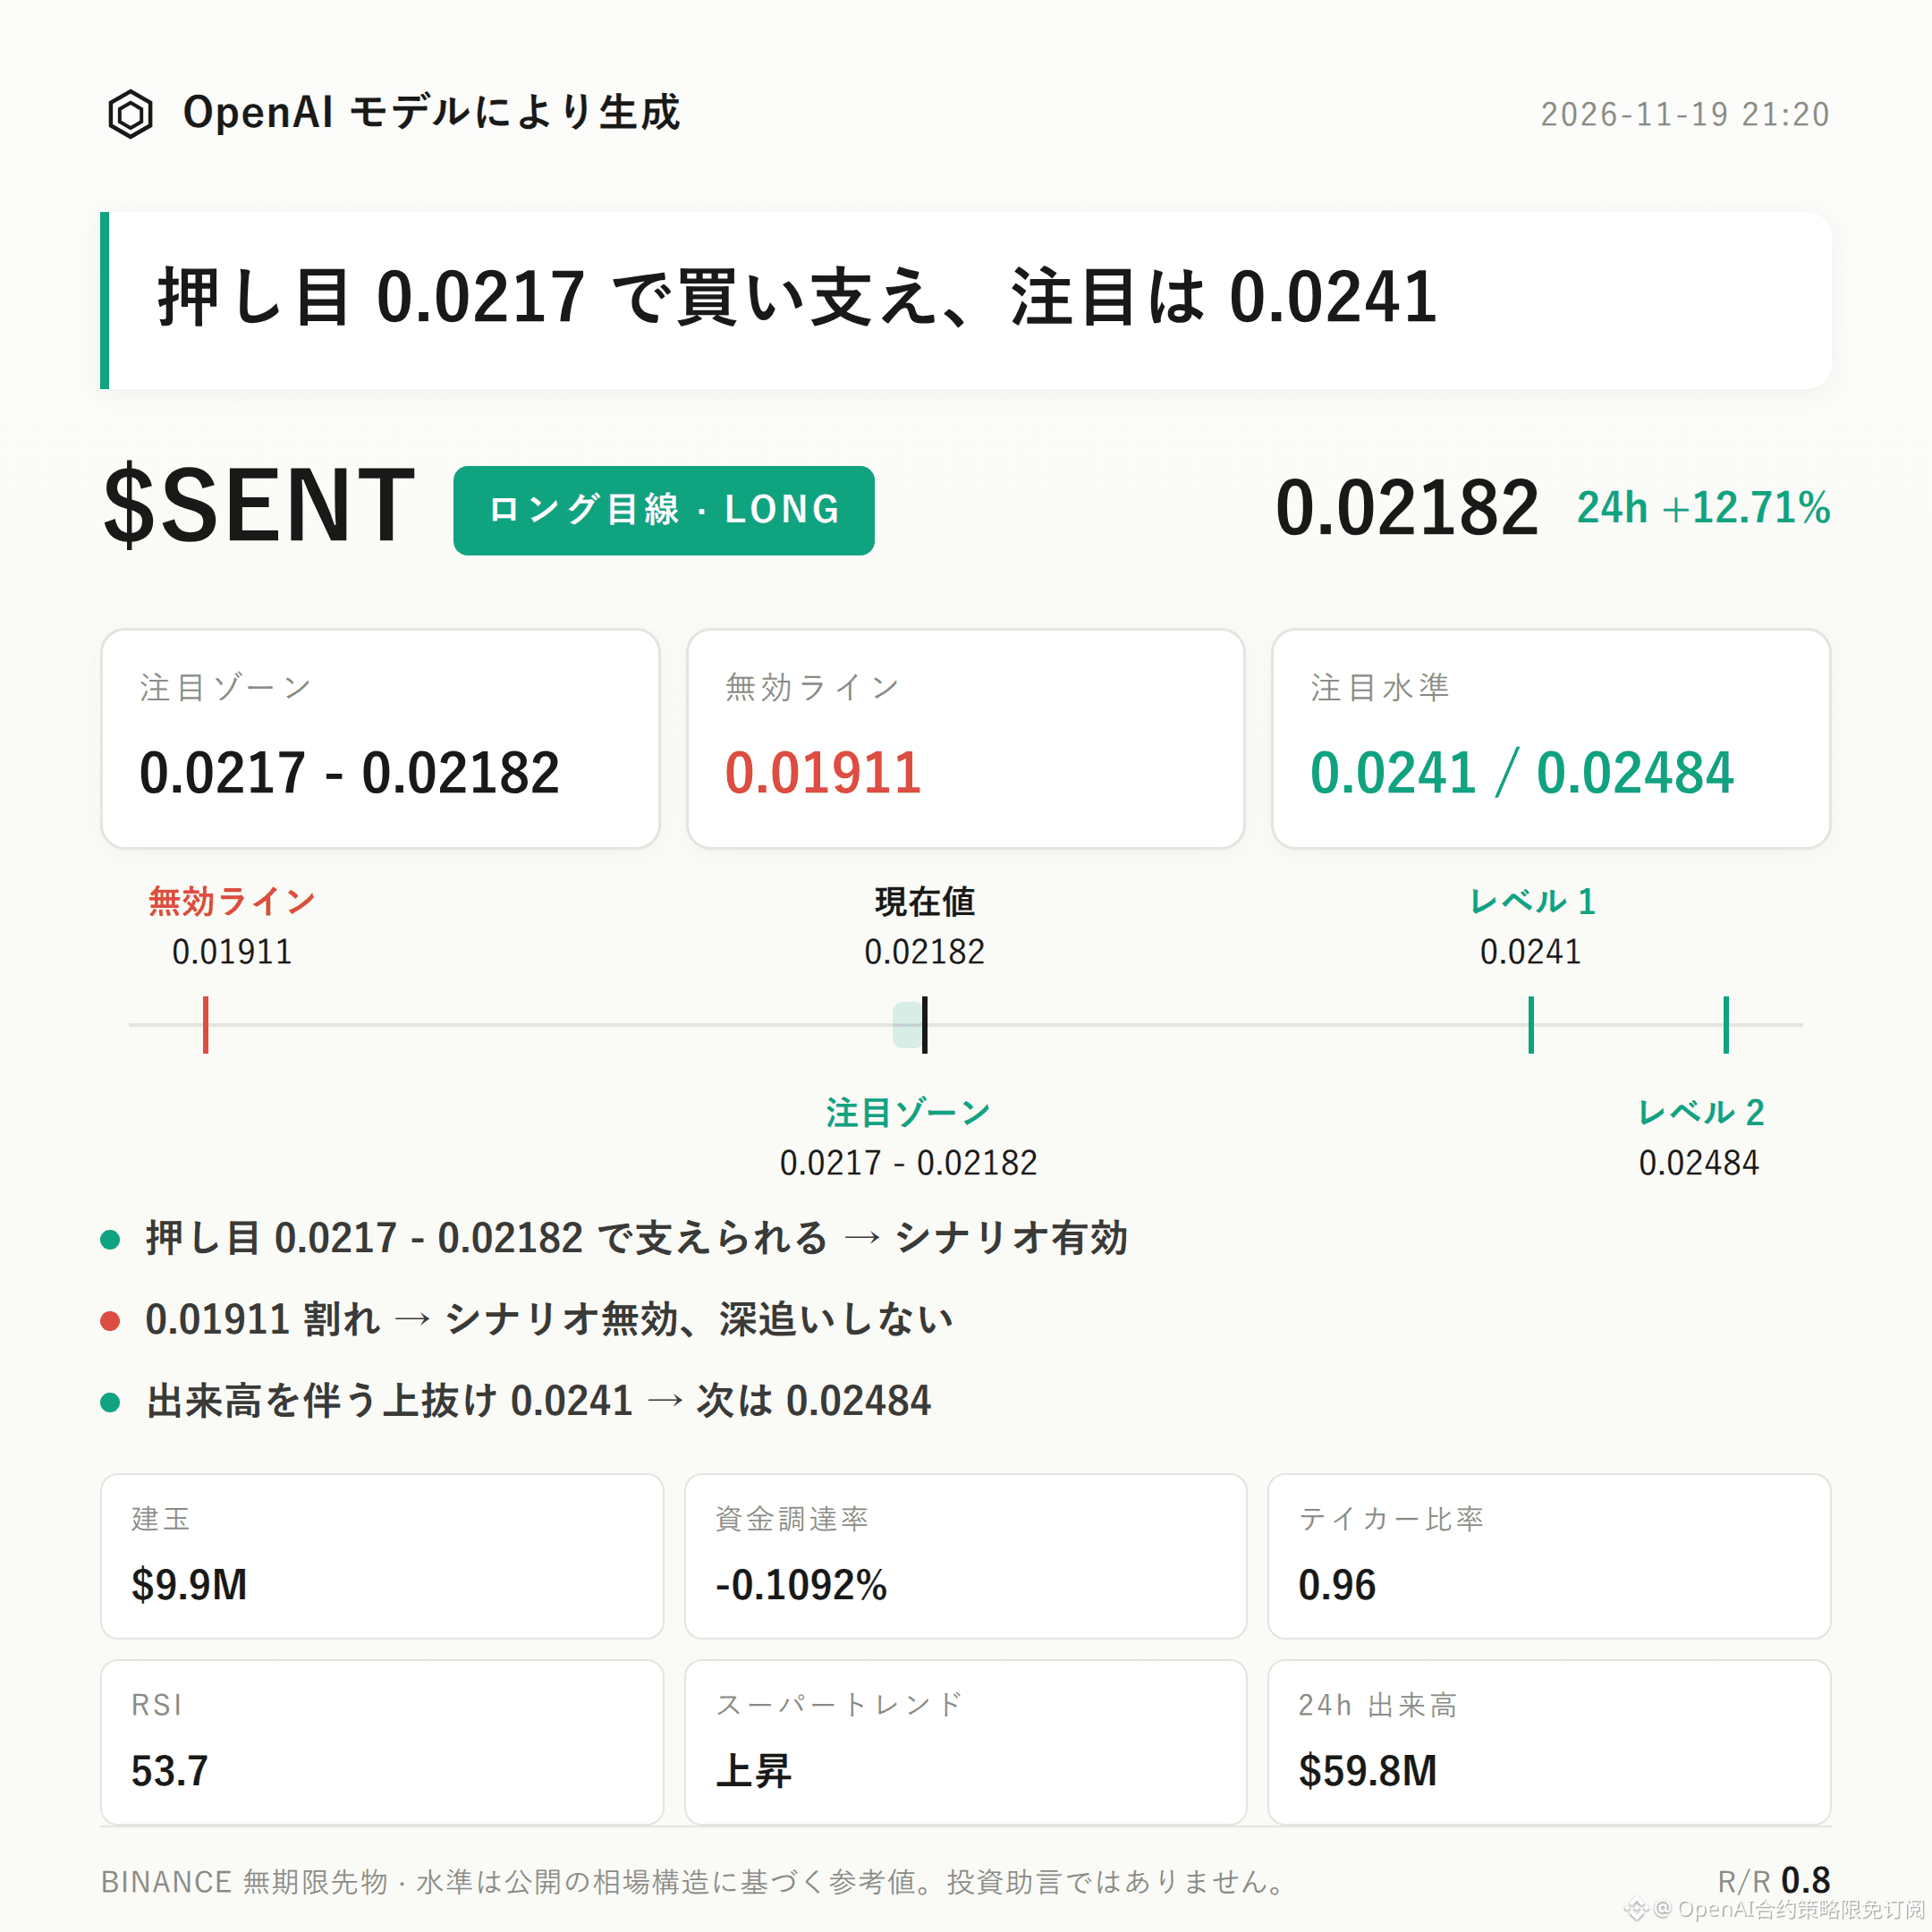
$SENT Bullish bias | Focus zone: 0.0217–0.02182 | Invalidation reference: 0.01911 | Levels to watch: 0.0241 / 0.02484
$SENT is currently showing a bullish structure, with a time horizon ranging from intraday to several days.
The Supertrend is rising, MACD continues to show bullish momentum, and open interest has increased by 36.2% over the past 24 hours. These form the core basis for the current bullish thesis.
The key is to verify whether the bullish focus zone continues to provide support, rather than simply chasing the 12.71% gain over the past 24 hours.
The current price is 0.02182, trading above the Bollinger Band middle line at 0.0217. The upper band at 0.0241 is the first extension level to watch.
RSI is 53.7, still within a relatively healthy range, and the Supertrend and MACD are aligned in direction.
Recent volatility boundaries can be gauged by the high of 0.02484 and the low of 0.01911. Whether the structure continues will need to be confirmed by actual price action at these levels.
24-hour trading volume is $59.81 million, and open interest is $9.9 million. Open interest also rose 36.2% over the same period, indicating that futures market participation increased alongside the price rise.
The funding rate is -0.1092%, while the proportion of long accounts is 57%, suggesting some disagreement within the market.
The taker buy/sell ratio is only 0.96, meaning aggressive buyers have yet to gain the upper hand. This is countervailing evidence to keep in mind within the bullish structure.
First, watch the bullish focus zone at 0.0217–0.02182; it is preferable to wait for confirmation after a pullback is supported.
If the zone holds after a pullback, the bullish thesis remains valid.
If the invalidation reference at 0.01911 is reached, it would indicate that the current upward structure has been broken and the bullish thesis is invalidated. Do not stay in the trade.
If price breaks above the 0.0241 level to watch on increased volume, then watch for resistance near 0.02484.
The current reference risk/reward ratio is 0.8, so the potential reward is not particularly attractive. Combined with the taker buy/sell ratio below 1, be alert to insufficient upward momentum and increased volatility following the rapid rise in open interest.
When using leverage in futures, position discipline matters more than directional judgment.
For reference only; this is not investment advice. Futures involve leverage, and investing carries risk.
This article was created with the assistance of an OpenAI large language model.
$SENT #FuturesAnalysis
$SENT Bullish bias | Focus zone: 0.0217–0.02182 | Invalidation reference: 0.01911 | Levels to watch: 0.0241 / 0.02484
$SENT is currently showing a bullish structure, with a time horizon ranging from intraday to several days.
The Supertrend is rising, MACD continues to show bullish momentum, and open interest has increased by 36.2% over the past 24 hours. These form the core basis for the current bullish thesis.
The key is to verify whether the bullish focus zone continues to provide support, rather than simply chasing the 12.71% gain over the past 24 hours.
The current price is 0.02182, trading above the Bollinger Band middle line at 0.0217. The upper band at 0.0241 is the first extension level to watch.
RSI is 53.7, still within a relatively healthy range, and the Supertrend and MACD are aligned in direction.
Recent volatility boundaries can be gauged by the high of 0.02484 and the low of 0.01911. Whether the structure continues will need to be confirmed by actual price action at these levels.
24-hour trading volume is $59.81 million, and open interest is $9.9 million. Open interest also rose 36.2% over the same period, indicating that futures market participation increased alongside the price rise.
The funding rate is -0.1092%, while the proportion of long accounts is 57%, suggesting some disagreement within the market.
The taker buy/sell ratio is only 0.96, meaning aggressive buyers have yet to gain the upper hand. This is countervailing evidence to keep in mind within the bullish structure.
First, watch the bullish focus zone at 0.0217–0.02182; it is preferable to wait for confirmation after a pullback is supported.
If the zone holds after a pullback, the bullish thesis remains valid.
If the invalidation reference at 0.01911 is reached, it would indicate that the current upward structure has been broken and the bullish thesis is invalidated. Do not stay in the trade.
If price breaks above the 0.0241 level to watch on increased volume, then watch for resistance near 0.02484.
The current reference risk/reward ratio is 0.8, so the potential reward is not particularly attractive. Combined with the taker buy/sell ratio below 1, be alert to insufficient upward momentum and increased volatility following the rapid rise in open interest.
When using leverage in futures, position discipline matters more than directional judgment.
For reference only; this is not investment advice. Futures involve leverage, and investing carries risk.
This article was created with the assistance of an OpenAI large language model.
$SENT #FuturesAnalysis