The $BTC file is heading into a 7th consecutive red week. On Binance, a streak this long has happened only once since 2017.
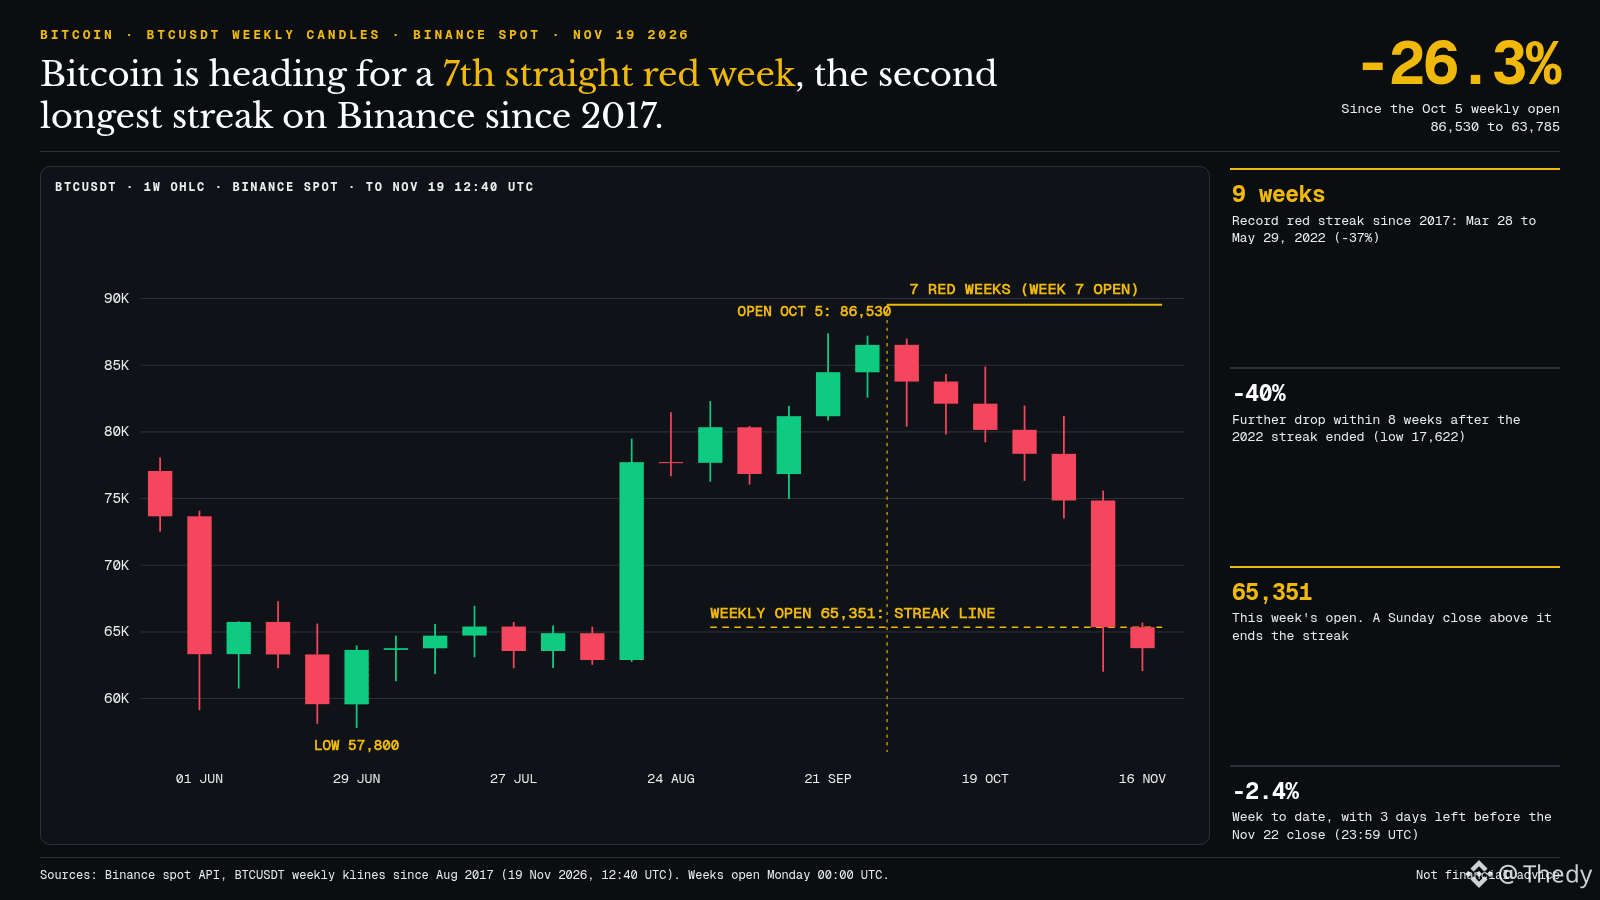
The chart shows weekly BTCUSDT spot candles on Binance. Six weeks have closed lower since the October 5 open at 86,530, and the 7th is off to a bad start: it opened Monday at 65,351 and is trading at 63,785 this Thursday, 19/11, at 12:40 UTC, down 2.4%. Across the entire streak, that amounts to a 26.3% drop.
I went through the pair’s entire weekly history (since August 2017) to count streaks of 5 or more red weeks. There are only four: 5 weeks in late 2018, 9 weeks between 28/03 and 29/05/2022 (-37%), 6 weeks in January–February 2026, and this one.
Here’s what the previous examples tell us, without treating them as a rule. After the 2022 streak, BTC fell another 40% over eight weeks (bottoming at 17,622 in June, during the Luna/3AC episode). After the February 2026 streak, the next low was only 1% below the last close, and the price had recovered 19.6% eight weeks later. Two opposite outcomes from the same signal: the length of a streak doesn’t tell us much about what comes next.
What matters between now and Sunday at 23:59 UTC is the weekly close. Above 65,351, the streak ends at six weeks. Below that, we match the pair’s second-longest streak, with the November 15 low of 62,006 as the first reference point. On the flows front, US spot bitcoin ETFs have already seen more than $2.5B in net outflows in November (SoSoValue), which isn’t helping buyers.
My read: as long as 65,351 isn’t reclaimed at the close, the market remains bearish on the timeframe that matters to funds. A green close wouldn’t change the trend, but it would at least break the pattern.
Do you think Sunday’s close will be above or below 65,351?
#Bitcoin #BTC
The chart shows weekly BTCUSDT spot candles on Binance. Six weeks have closed lower since the October 5 open at 86,530, and the 7th is off to a bad start: it opened Monday at 65,351 and is trading at 63,785 this Thursday, 19/11, at 12:40 UTC, down 2.4%. Across the entire streak, that amounts to a 26.3% drop.
I went through the pair’s entire weekly history (since August 2017) to count streaks of 5 or more red weeks. There are only four: 5 weeks in late 2018, 9 weeks between 28/03 and 29/05/2022 (-37%), 6 weeks in January–February 2026, and this one.
Here’s what the previous examples tell us, without treating them as a rule. After the 2022 streak, BTC fell another 40% over eight weeks (bottoming at 17,622 in June, during the Luna/3AC episode). After the February 2026 streak, the next low was only 1% below the last close, and the price had recovered 19.6% eight weeks later. Two opposite outcomes from the same signal: the length of a streak doesn’t tell us much about what comes next.
What matters between now and Sunday at 23:59 UTC is the weekly close. Above 65,351, the streak ends at six weeks. Below that, we match the pair’s second-longest streak, with the November 15 low of 62,006 as the first reference point. On the flows front, US spot bitcoin ETFs have already seen more than $2.5B in net outflows in November (SoSoValue), which isn’t helping buyers.
My read: as long as 65,351 isn’t reclaimed at the close, the market remains bearish on the timeframe that matters to funds. A green close wouldn’t change the trend, but it would at least break the pattern.
Do you think Sunday’s close will be above or below 65,351?
#Bitcoin #BTC