$BTC - Bitcoin Current Analysis
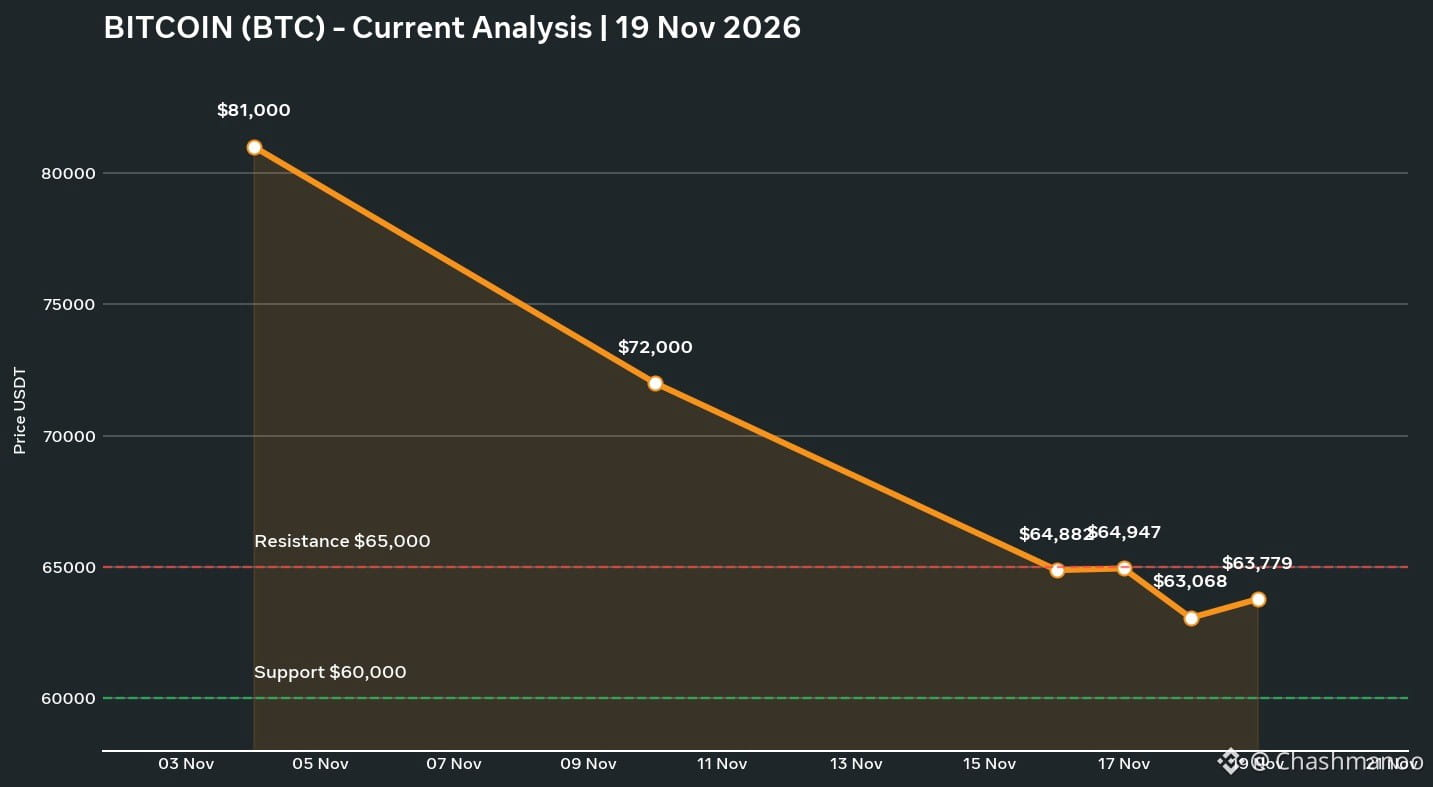
*Current Price:* ~ *$63,779*
*24h Range:* $62,062 - $64,245 f722
### 1. What Is the Trend? - BEARISH / DOWN
Bitcoin has fallen from *$81,000* on Nov 4 to *$63,779*. This means it has dropped by more than *-21%* in 15 days. e543
The price is currently *below* all its major averages (7-day, 20-day, 50-day, 200-day), which is a bearish sign. 8a4a
### 2. Key Levels
Level Price
**Resistance 1** $65,174
**Resistance 2** $66,508
**Support 1** $62,284
**Strong Support** $60,728
If it moves above $65,174, that would be slightly bullish; otherwise, it could fall to $60,000. 8a4a
### 3. What Are the Indicators Saying?
- *RSI (14):* 24.89 - It is *oversold*, meaning it has fallen a lot; a slight bounce could happen from here.
- *Fear & Greed:* 15 - It is in *Extreme Fear* territory; people are selling out of fear.
- *ETF Outflows:* Money is continuing to flow out of Bitcoin ETFs; ∼$1 Billion has flowed out in 2 weeks.
#BTCRemainsUnderPressureAfterHawkishFOMCMinutes #NvidiaBoardReportedlySplitOverHuang’sReturn #CanGTA6'sLaunchLiftTTWOShares? #CapitalGroupAdds1264500StrategyShares #FOMCMinutesHighlightAIDebtRisks
*Current Price:* ~ *$63,779*
*24h Range:* $62,062 - $64,245 f722
### 1. What Is the Trend? - BEARISH / DOWN
Bitcoin has fallen from *$81,000* on Nov 4 to *$63,779*. This means it has dropped by more than *-21%* in 15 days. e543
The price is currently *below* all its major averages (7-day, 20-day, 50-day, 200-day), which is a bearish sign. 8a4a
### 2. Key Levels
Level Price
**Resistance 1** $65,174
**Resistance 2** $66,508
**Support 1** $62,284
**Strong Support** $60,728
If it moves above $65,174, that would be slightly bullish; otherwise, it could fall to $60,000. 8a4a
### 3. What Are the Indicators Saying?
- *RSI (14):* 24.89 - It is *oversold*, meaning it has fallen a lot; a slight bounce could happen from here.
- *Fear & Greed:* 15 - It is in *Extreme Fear* territory; people are selling out of fear.
- *ETF Outflows:* Money is continuing to flow out of Bitcoin ETFs; ∼$1 Billion has flowed out in 2 weeks.
#BTCRemainsUnderPressureAfterHawkishFOMCMinutes #NvidiaBoardReportedlySplitOverHuang’sReturn #CanGTA6'sLaunchLiftTTWOShares? #CapitalGroupAdds1264500StrategyShares #FOMCMinutesHighlightAIDebtRisks