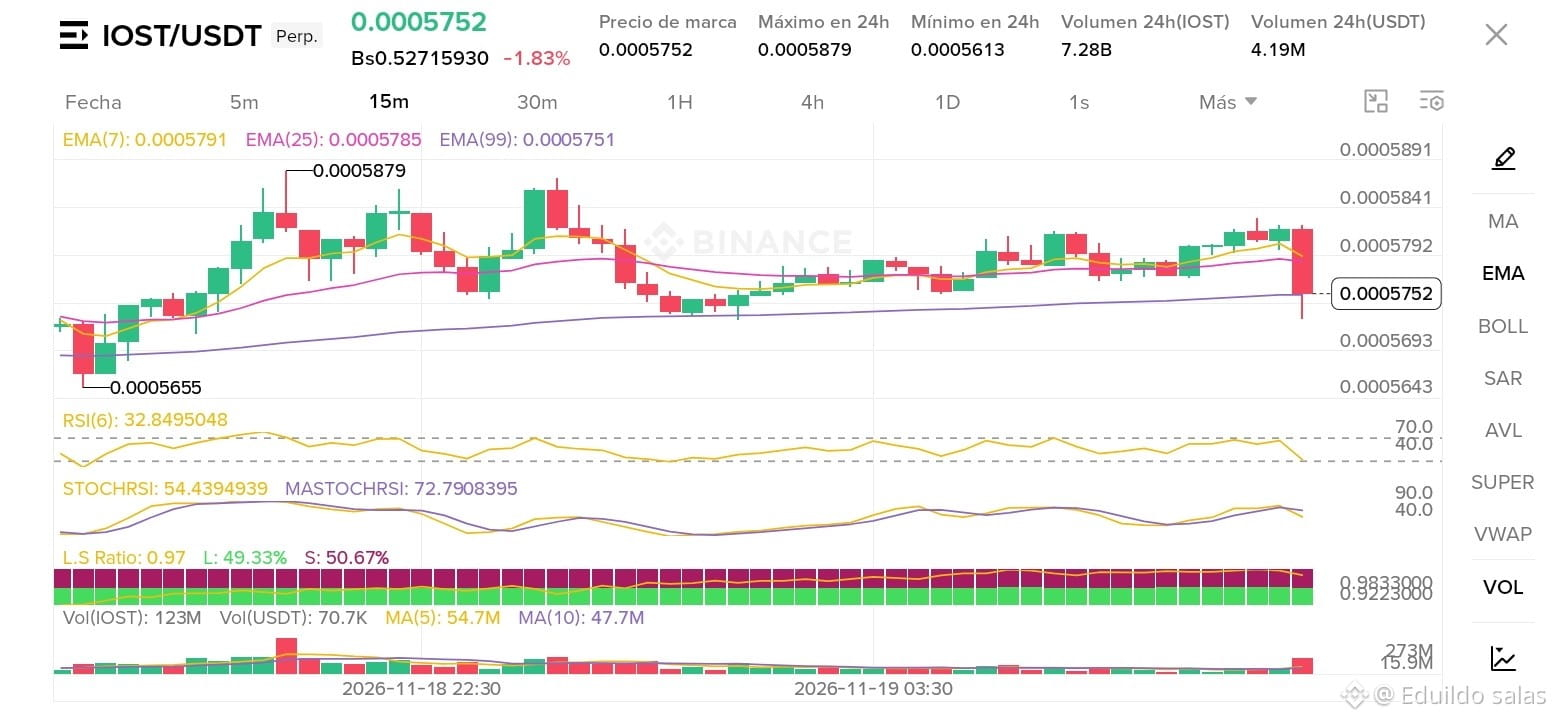
🚨 $IOST /USDT (15m) — Key battle right above the EMA(99)! 🚨
Price is trading at 0.0005752 USDT (-1.83% in 24h) after pulling back from the 0.000583–0.000584 zone, finding support at the EMA(99) at 0.0005751 while facing immediate resistance at the EMA(7) at 0.0005791 and the EMA(25) at 0.0005785.
📊 Quick chart overview:
24h High / Low: 0.0005879 / 0.0005613 | 24h Vol.: 7.28B IOST (4.19M USDT).
RSI(6): 32.85 — nearing oversold territory on the 15m timeframe; watch for a possible technical bounce or further downside if support gives way.
StochRSI: 54.44 (MA: 72.79) — losing short-term momentum.
L/S Ratio: 0.97 (49.33% Longs vs. 50.67% Shorts) — the market is virtually balanced, with slight bearish pressure on positions.
Volume: Red volume spike on the latest candle (123M IOST vs. an MA(5) of 54.7M), indicating strong selling pressure in the latest move.
🎯 Levels to watch:
Key support: 0.0005751 (EMA 99), then 0.0005693–0.0005643 below.
Resistance: 0.0005785–0.0005792, then 0.0005841–0.0005879.
A bounce from the EMA(99) or a breakdown toward lower support levels? What do you think, Long or Short? 👇
#IOSTUSDT #BinanceSquare #NvidiaBoardReportedlySplitOverHuang’sReturn
Price is trading at 0.0005752 USDT (-1.83% in 24h) after pulling back from the 0.000583–0.000584 zone, finding support at the EMA(99) at 0.0005751 while facing immediate resistance at the EMA(7) at 0.0005791 and the EMA(25) at 0.0005785.
📊 Quick chart overview:
24h High / Low: 0.0005879 / 0.0005613 | 24h Vol.: 7.28B IOST (4.19M USDT).
RSI(6): 32.85 — nearing oversold territory on the 15m timeframe; watch for a possible technical bounce or further downside if support gives way.
StochRSI: 54.44 (MA: 72.79) — losing short-term momentum.
L/S Ratio: 0.97 (49.33% Longs vs. 50.67% Shorts) — the market is virtually balanced, with slight bearish pressure on positions.
Volume: Red volume spike on the latest candle (123M IOST vs. an MA(5) of 54.7M), indicating strong selling pressure in the latest move.
🎯 Levels to watch:
Key support: 0.0005751 (EMA 99), then 0.0005693–0.0005643 below.
Resistance: 0.0005785–0.0005792, then 0.0005841–0.0005879.
A bounce from the EMA(99) or a breakdown toward lower support levels? What do you think, Long or Short? 👇
#IOSTUSDT #BinanceSquare #NvidiaBoardReportedlySplitOverHuang’sReturn