$BTC
Citi cuts BTC target to 99,532—but that's still 56% above the current price
At 9:16 this morning, Citi lowered its BTC benchmark price target to $99,532 and its ETH target to $2,838. Headlines all said “cut,” while captions shared in group chats all said “institutions have turned bearish.”
I punched the numbers into a calculator twice, and came to exactly the opposite conclusion.
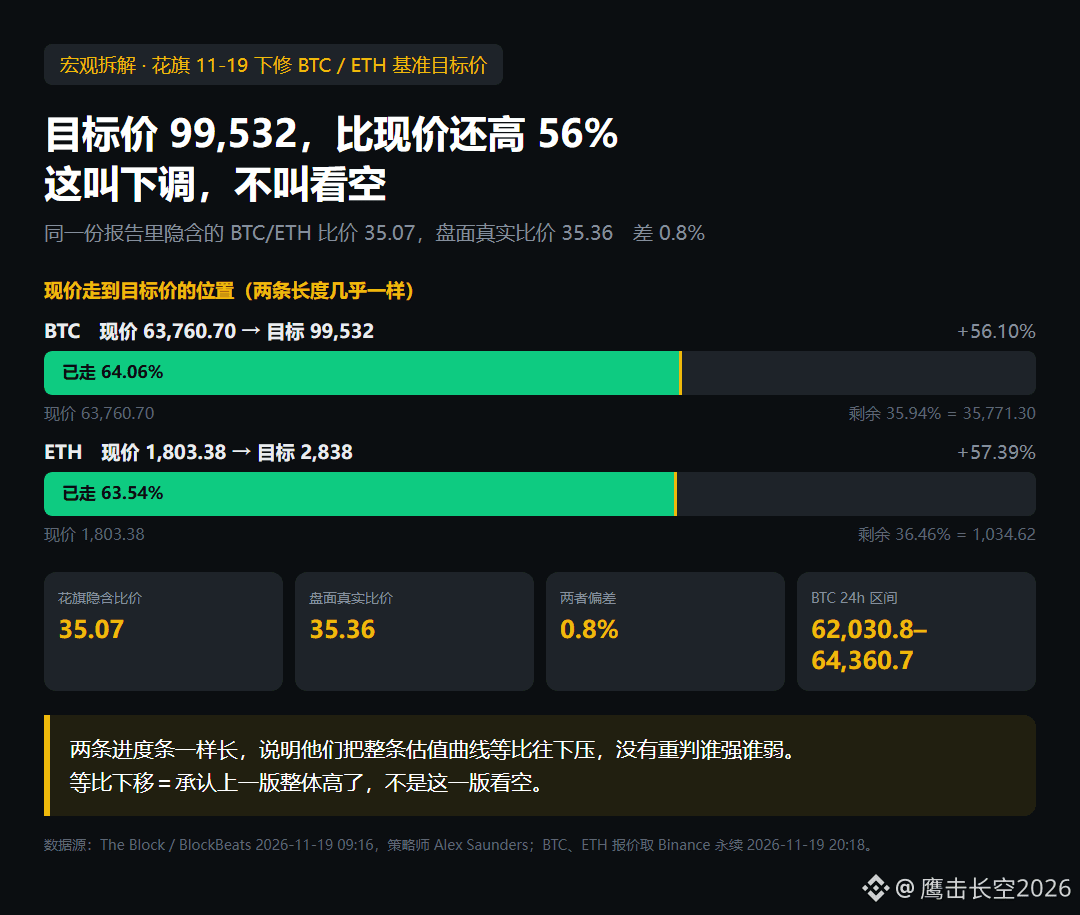
BTC is now at 63,760.70. Citi’s new target of 99,532 is 56.10% above the current price. ETH’s new target is 2,838, which is 57.39% above its current price.
A price target that remains half again as high as the current price even after a “cut” isn’t bearish. It’s an admission that the previous version was overestimated.
The ratio is what’s really worth watching. The BTC/ETH ratio implied by Citi’s two targets is 99,532 divided by 2,838, or 35.07. The actual market ratio, calculated by dividing BTC’s current price by ETH’s, is 35.36.
The two ratios differ by 0.8%.
What does that tell us? It tells us this revision was a uniform downward shift—they lowered the entire valuation curve by the same proportion, without reassessing whether BTC or ETH is stronger. A uniform downward shift means only one thing: the previous absolute levels didn’t hold up, not that this version is bearish.
Retail investors change their price targets in exactly the opposite way. A retail investor says, “Yesterday I called for 120,000; today I’m revising it to 90,000 because I’m scared.” A sell-side analyst says, “A few inputs in my model changed, so the output changed accordingly; the ratio can’t move.”
Strategist Alex Saunders gives five very practical reasons: weakening ETF demand, deleveraging in futures markets, a stronger dollar, rising real yields, and increased stock market volatility. All five relate to demand and financial conditions. Not one says, “The Bitcoin story has run its course.”
So 99,532 shouldn’t be treated as a prediction; it should be treated as a yardstick. It tells you that, assuming “ETF demand returns to neutral and the dollar stops strengthening,” the model comes up with 99,500. The current price is 63,700, and that 56% gap is the discount created by those five deteriorating factors.
When will that discount disappear? I’m watching just two things: the dollar index turning lower, and ETFs shifting from net outflows to net inflows. Neither signal has appeared yet, so I’m sitting tight today.
BTC is now at 63,760.70, with a 24-hour range of 62,030.80 to 64,360.70. The last twenty candles are concentrated between 63,516 and 64,056. The price has just bounced back from around 62,030.80 and is sitting at 92.7% of the range.
My view: As long as 62,030.80 holds, this is “valuation being compressed,” not “the trend being broken.” If 62,030.80 really breaks, Citi’s 99,500 chart can be torn up—I won’t buy the dip either.
A: Price targets are lagging indicators; the bottom will be in by the time they change their tune
B: BTC can reach 99,532 by the end of this year
C: Let’s see if 62,030 breaks first
#比特币 #美联储 #ETF
Citi cuts BTC target to 99,532—but that's still 56% above the current price
At 9:16 this morning, Citi lowered its BTC benchmark price target to $99,532 and its ETH target to $2,838. Headlines all said “cut,” while captions shared in group chats all said “institutions have turned bearish.”
I punched the numbers into a calculator twice, and came to exactly the opposite conclusion.
BTC is now at 63,760.70. Citi’s new target of 99,532 is 56.10% above the current price. ETH’s new target is 2,838, which is 57.39% above its current price.
A price target that remains half again as high as the current price even after a “cut” isn’t bearish. It’s an admission that the previous version was overestimated.
The ratio is what’s really worth watching. The BTC/ETH ratio implied by Citi’s two targets is 99,532 divided by 2,838, or 35.07. The actual market ratio, calculated by dividing BTC’s current price by ETH’s, is 35.36.
The two ratios differ by 0.8%.
What does that tell us? It tells us this revision was a uniform downward shift—they lowered the entire valuation curve by the same proportion, without reassessing whether BTC or ETH is stronger. A uniform downward shift means only one thing: the previous absolute levels didn’t hold up, not that this version is bearish.
Retail investors change their price targets in exactly the opposite way. A retail investor says, “Yesterday I called for 120,000; today I’m revising it to 90,000 because I’m scared.” A sell-side analyst says, “A few inputs in my model changed, so the output changed accordingly; the ratio can’t move.”
Strategist Alex Saunders gives five very practical reasons: weakening ETF demand, deleveraging in futures markets, a stronger dollar, rising real yields, and increased stock market volatility. All five relate to demand and financial conditions. Not one says, “The Bitcoin story has run its course.”
So 99,532 shouldn’t be treated as a prediction; it should be treated as a yardstick. It tells you that, assuming “ETF demand returns to neutral and the dollar stops strengthening,” the model comes up with 99,500. The current price is 63,700, and that 56% gap is the discount created by those five deteriorating factors.
When will that discount disappear? I’m watching just two things: the dollar index turning lower, and ETFs shifting from net outflows to net inflows. Neither signal has appeared yet, so I’m sitting tight today.
BTC is now at 63,760.70, with a 24-hour range of 62,030.80 to 64,360.70. The last twenty candles are concentrated between 63,516 and 64,056. The price has just bounced back from around 62,030.80 and is sitting at 92.7% of the range.
My view: As long as 62,030.80 holds, this is “valuation being compressed,” not “the trend being broken.” If 62,030.80 really breaks, Citi’s 99,500 chart can be torn up—I won’t buy the dip either.
A: Price targets are lagging indicators; the bottom will be in by the time they change their tune
B: BTC can reach 99,532 by the end of this year
C: Let’s see if 62,030 breaks first
#比特币 #美联储 #ETF