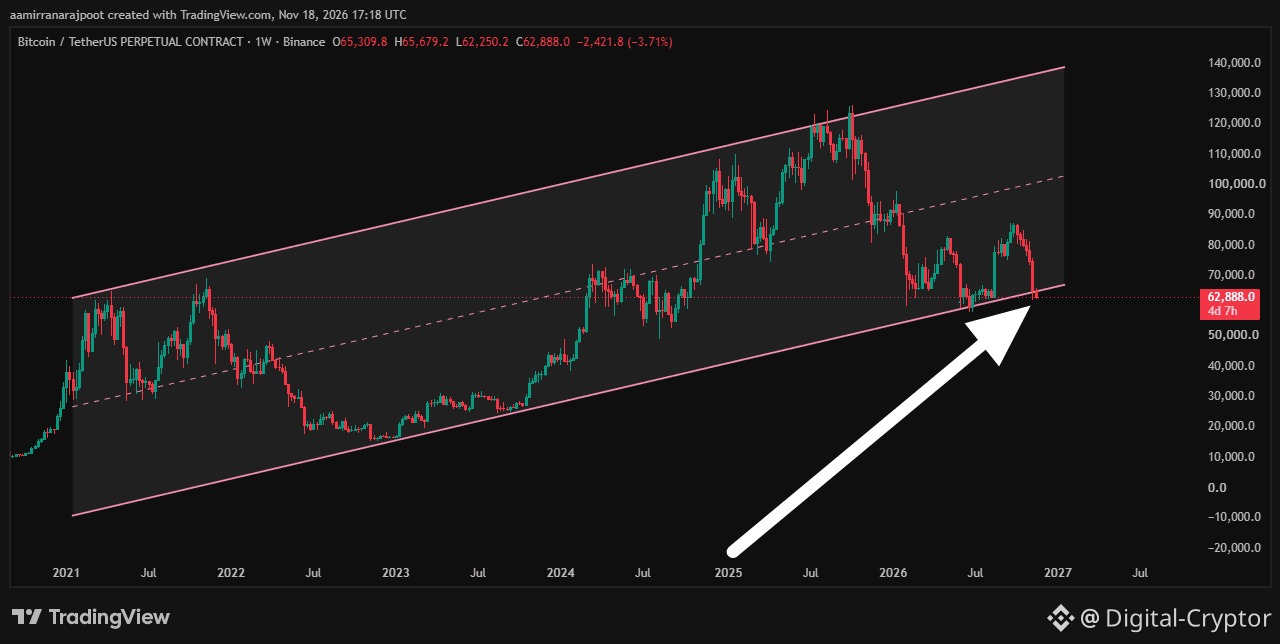
2021–2027: THE ULTIMATE BITCOIN SUPPORT TEST?
Terrifying scene from the $BTC in weekly Chart.
🚨 BITCOIN IS STANDING AT THE EDGE OF A CLIFF! ☠️
Something terrifying is happening on the BTC weekly chart.
Since 2021, Bitcoin has been moving inside a massive ascending channel.
Now, after years of maintaining this structure, BTC is approaching its LOWER TRENDLINE once again.
📉 Current Price: $62,888
⚠️ This is no ordinary support level.
If Bitcoin loses this long-term ascending channel on a confirmed weekly closing basis, the consequences could be brutal for the entire market.
The structure that supported Bitcoin for years could finally be breaking.
But there's still one question:
WILL THE LOWER TRENDLINE SAVE THE BULLS, OR ARE WE ABOUT TO WITNESS A HISTORIC STRUCTURAL BREAKDOWN?
One weekly close could change the entire narrative.
Just imagine if $BTC break this support what will be the next support.? 40k or 30k.?😱
☠️ THIS IS THE BATTLE ZONE.
Terrifying scene from the $BTC in weekly Chart.
🚨 BITCOIN IS STANDING AT THE EDGE OF A CLIFF! ☠️
Something terrifying is happening on the BTC weekly chart.
Since 2021, Bitcoin has been moving inside a massive ascending channel.
Now, after years of maintaining this structure, BTC is approaching its LOWER TRENDLINE once again.
📉 Current Price: $62,888
⚠️ This is no ordinary support level.
If Bitcoin loses this long-term ascending channel on a confirmed weekly closing basis, the consequences could be brutal for the entire market.
The structure that supported Bitcoin for years could finally be breaking.
But there's still one question:
WILL THE LOWER TRENDLINE SAVE THE BULLS, OR ARE WE ABOUT TO WITNESS A HISTORIC STRUCTURAL BREAKDOWN?
One weekly close could change the entire narrative.
Just imagine if $BTC break this support what will be the next support.? 40k or 30k.?😱
☠️ THIS IS THE BATTLE ZONE.