$BONK: When Crowd Excitement Hits the Wrong Barrier
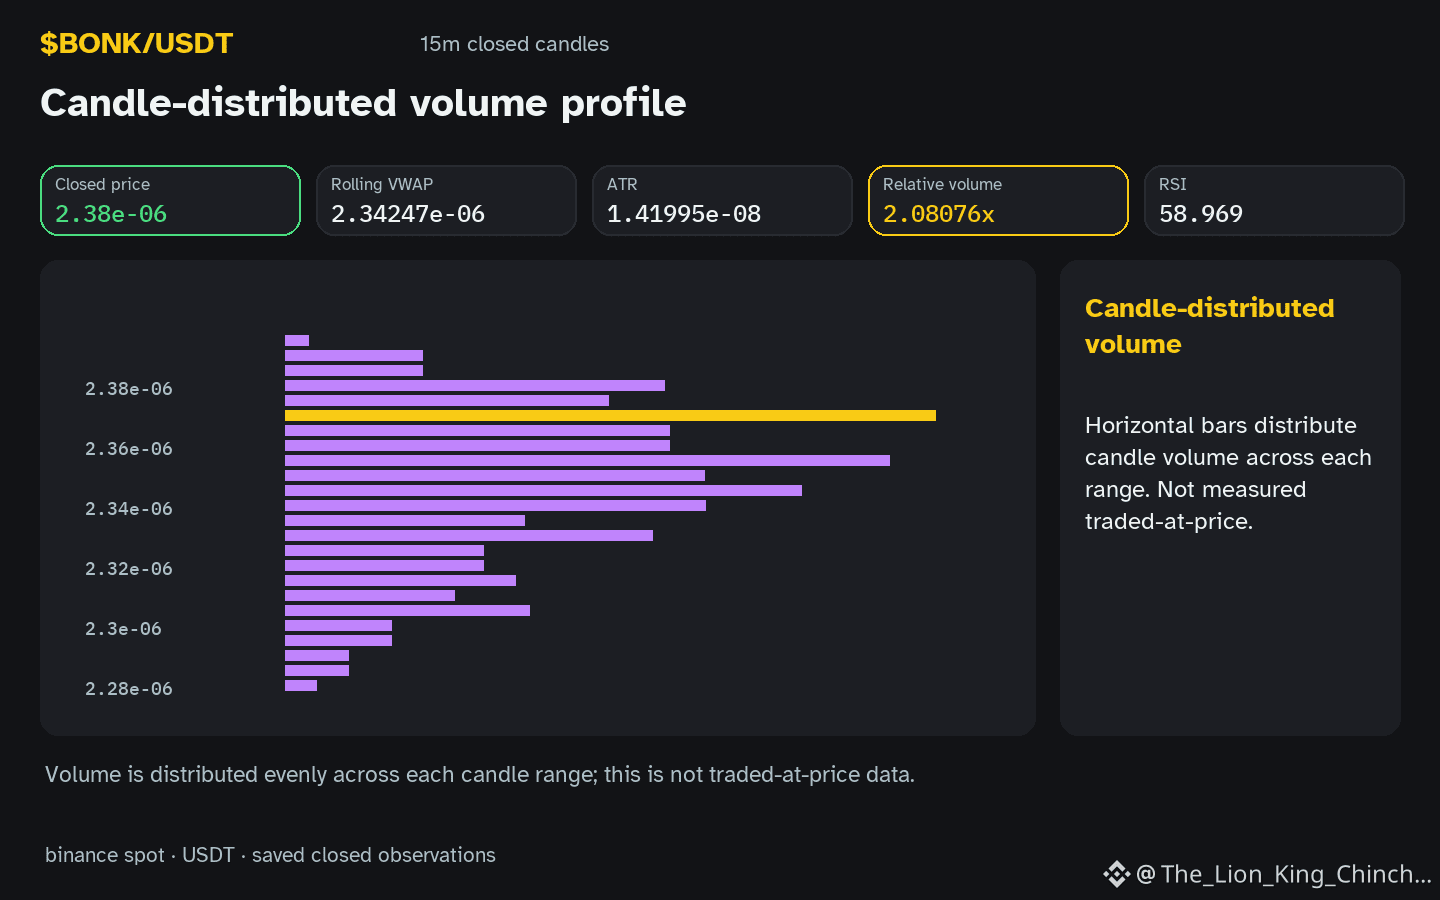
$BONK: BONK is moving up hourly while trading inside its recorded range and volume sits above baseline. Why does the crowd seem to rally at a point that may already be a structural barrier?
The observation can trigger an anchoring bias: traders latch onto the recent upward move and the loud volume spike, treating them as a fresh reference point. This can mask the fact that the price is still near a local resistance level, a zone that historically caps upside. If the anchoring effect dominates, participants may overlook the risk of a pull‑back and keep adding positions, believing the momentum will push through.
A more careful interpretation asks whether the volume surge simply reflects heightened attention rather than genuine buying pressure. The metric 2.08x baseline shows activity, but without confirming order‑flow quality it remains ambiguous. Similarly, the RSI 59.0 hints at modest overbought pressure but does not guarantee a breakout.
Possible reactions include a brief continuation followed by a reversal at the resistance, or a false breakout that quickly fizzles. A counterexample would be a scenario where the same volume spike occurs well below resistance and the price subsequently climbs higher, weakening the anchoring explanation.
Self‑check: before committing, ask if the current focus on the volume spike is outweighing the nearby resistance level in your analysis. If the next closed candle shows price failing to breach 2.38e-06 and RSI turning lower, reassess the bias and consider a more defensive stance. 🙏
Probabilistic market research, not a recommendation or guaranteed return.
#BONK
$BONK: BONK is moving up hourly while trading inside its recorded range and volume sits above baseline. Why does the crowd seem to rally at a point that may already be a structural barrier?
The observation can trigger an anchoring bias: traders latch onto the recent upward move and the loud volume spike, treating them as a fresh reference point. This can mask the fact that the price is still near a local resistance level, a zone that historically caps upside. If the anchoring effect dominates, participants may overlook the risk of a pull‑back and keep adding positions, believing the momentum will push through.
A more careful interpretation asks whether the volume surge simply reflects heightened attention rather than genuine buying pressure. The metric 2.08x baseline shows activity, but without confirming order‑flow quality it remains ambiguous. Similarly, the RSI 59.0 hints at modest overbought pressure but does not guarantee a breakout.
Possible reactions include a brief continuation followed by a reversal at the resistance, or a false breakout that quickly fizzles. A counterexample would be a scenario where the same volume spike occurs well below resistance and the price subsequently climbs higher, weakening the anchoring explanation.
Self‑check: before committing, ask if the current focus on the volume spike is outweighing the nearby resistance level in your analysis. If the next closed candle shows price failing to breach 2.38e-06 and RSI turning lower, reassess the bias and consider a more defensive stance. 🙏
Probabilistic market research, not a recommendation or guaranteed return.
#BONK