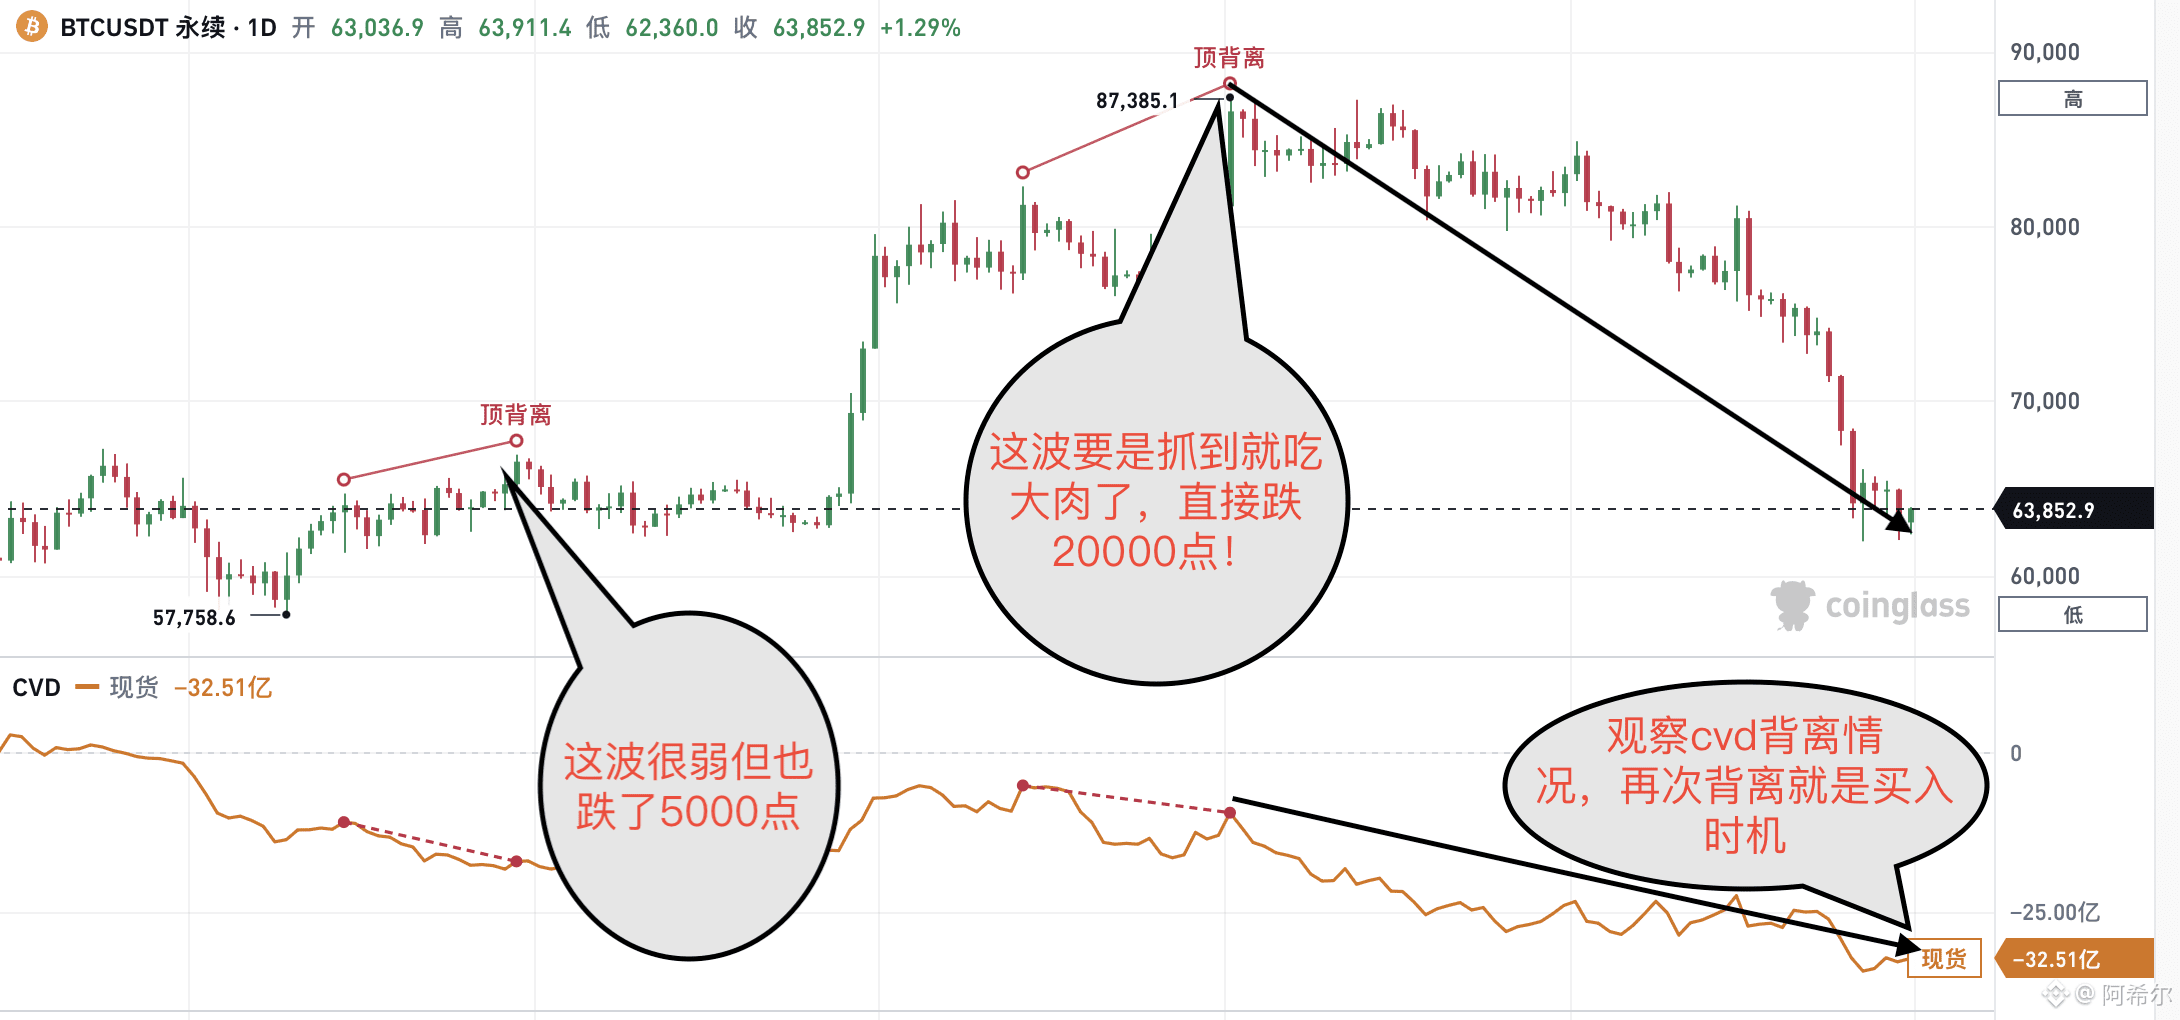
Looking at Bitcoin’s daily chart, spot CVD (cumulative aggressive buying and selling) showed two bearish divergences. Let’s take a closer look.
The first was near 66,000: CVD bearish divergence, followed by a drop of more than 4,000 points.
The second was at 87,385: this time, CVD showed bearish divergence at a high level, followed by a direct drop of more than 20,000 points.
If the daily chart shows a CVD bullish divergence again, it could be a good entry point. A rebound of at least a few thousand points wouldn’t be out of the question.
The first was near 66,000: CVD bearish divergence, followed by a drop of more than 4,000 points.
The second was at 87,385: this time, CVD showed bearish divergence at a high level, followed by a direct drop of more than 20,000 points.
If the daily chart shows a CVD bullish divergence again, it could be a good entry point. A rebound of at least a few thousand points wouldn’t be out of the question.