$BTC Pattern Watch: Potential Double Bottom Forming on the 4H Chart
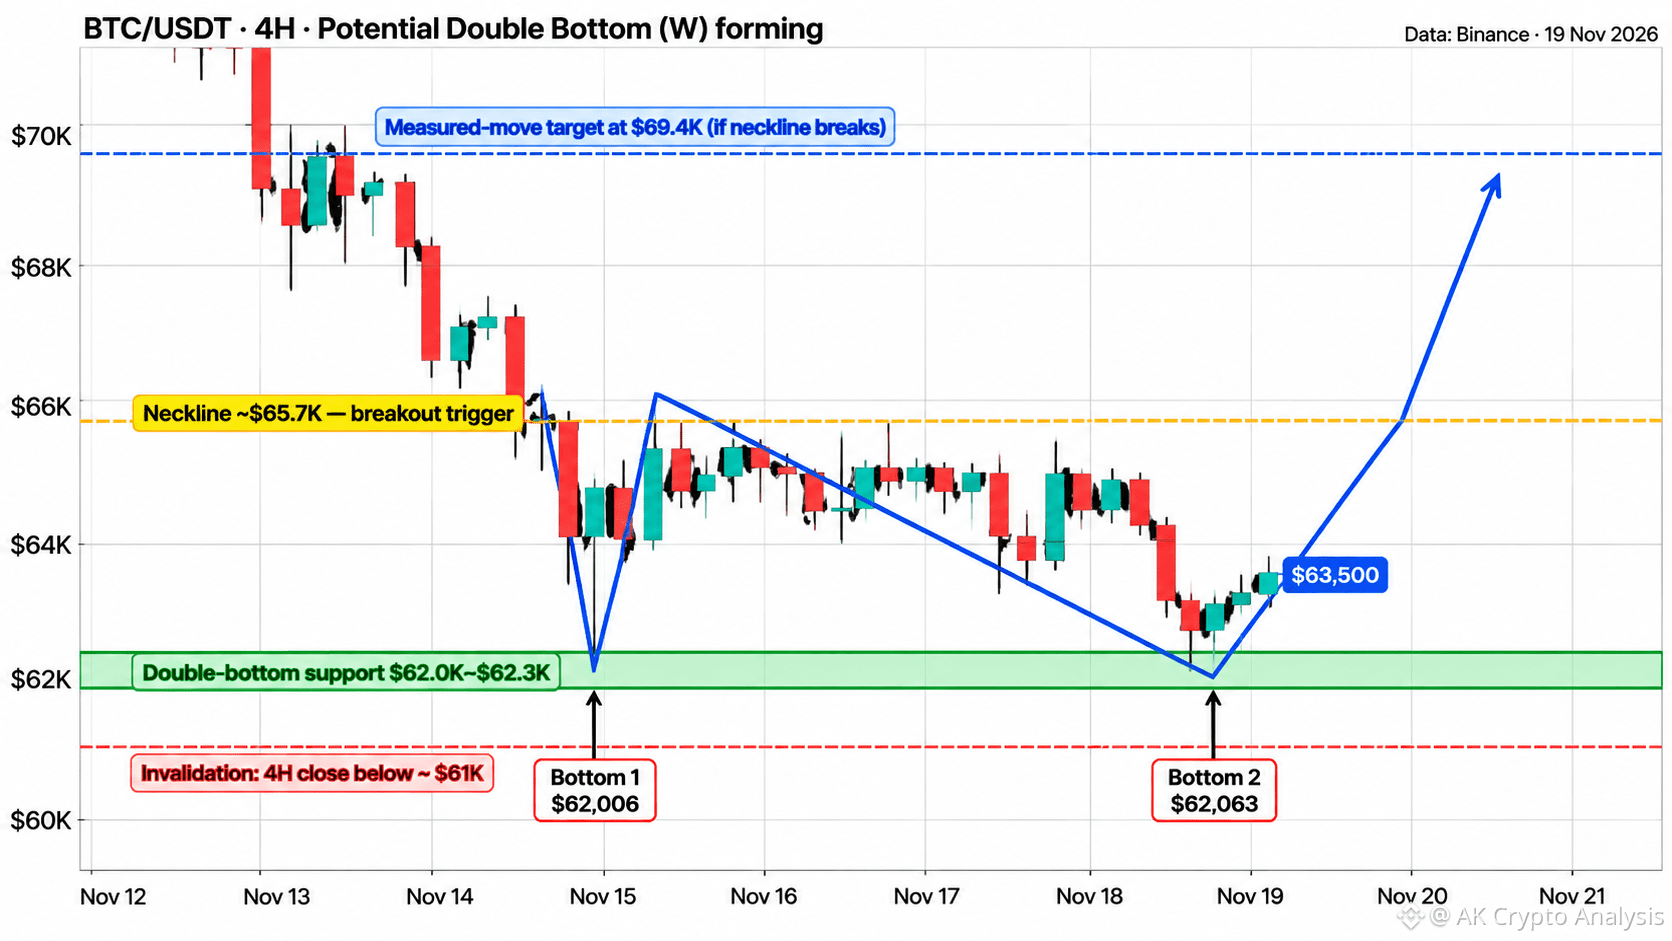
Bitcoin is showing signs of a potential double-bottom (W) formation near the $62K support zone.
Key Levels to Watch:
Bottom 1: $62,006 (Nov 15)
Bottom 2: $62,063 (Nov 19)
Neckline: $65,700
Bullish Scenario: A confirmed 4H candle close above $65,700 could validate the double-bottom pattern, opening the door for a potential move toward $69,400.
Bearish Invalidation: A 4H close below $61,000 would invalidate the setup.
The pattern is still developing. A confirmed neckline breakout is needed before considering the bullish scenario valid.
Not financial advice.
#BTCRemainsUnderPressureAfterHawkishFOMCMinutes
$BTC
Bitcoin is showing signs of a potential double-bottom (W) formation near the $62K support zone.
Key Levels to Watch:
Bottom 1: $62,006 (Nov 15)
Bottom 2: $62,063 (Nov 19)
Neckline: $65,700
Bullish Scenario: A confirmed 4H candle close above $65,700 could validate the double-bottom pattern, opening the door for a potential move toward $69,400.
Bearish Invalidation: A 4H close below $61,000 would invalidate the setup.
The pattern is still developing. A confirmed neckline breakout is needed before considering the bullish scenario valid.
Not financial advice.
#BTCRemainsUnderPressureAfterHawkishFOMCMinutes
$BTC