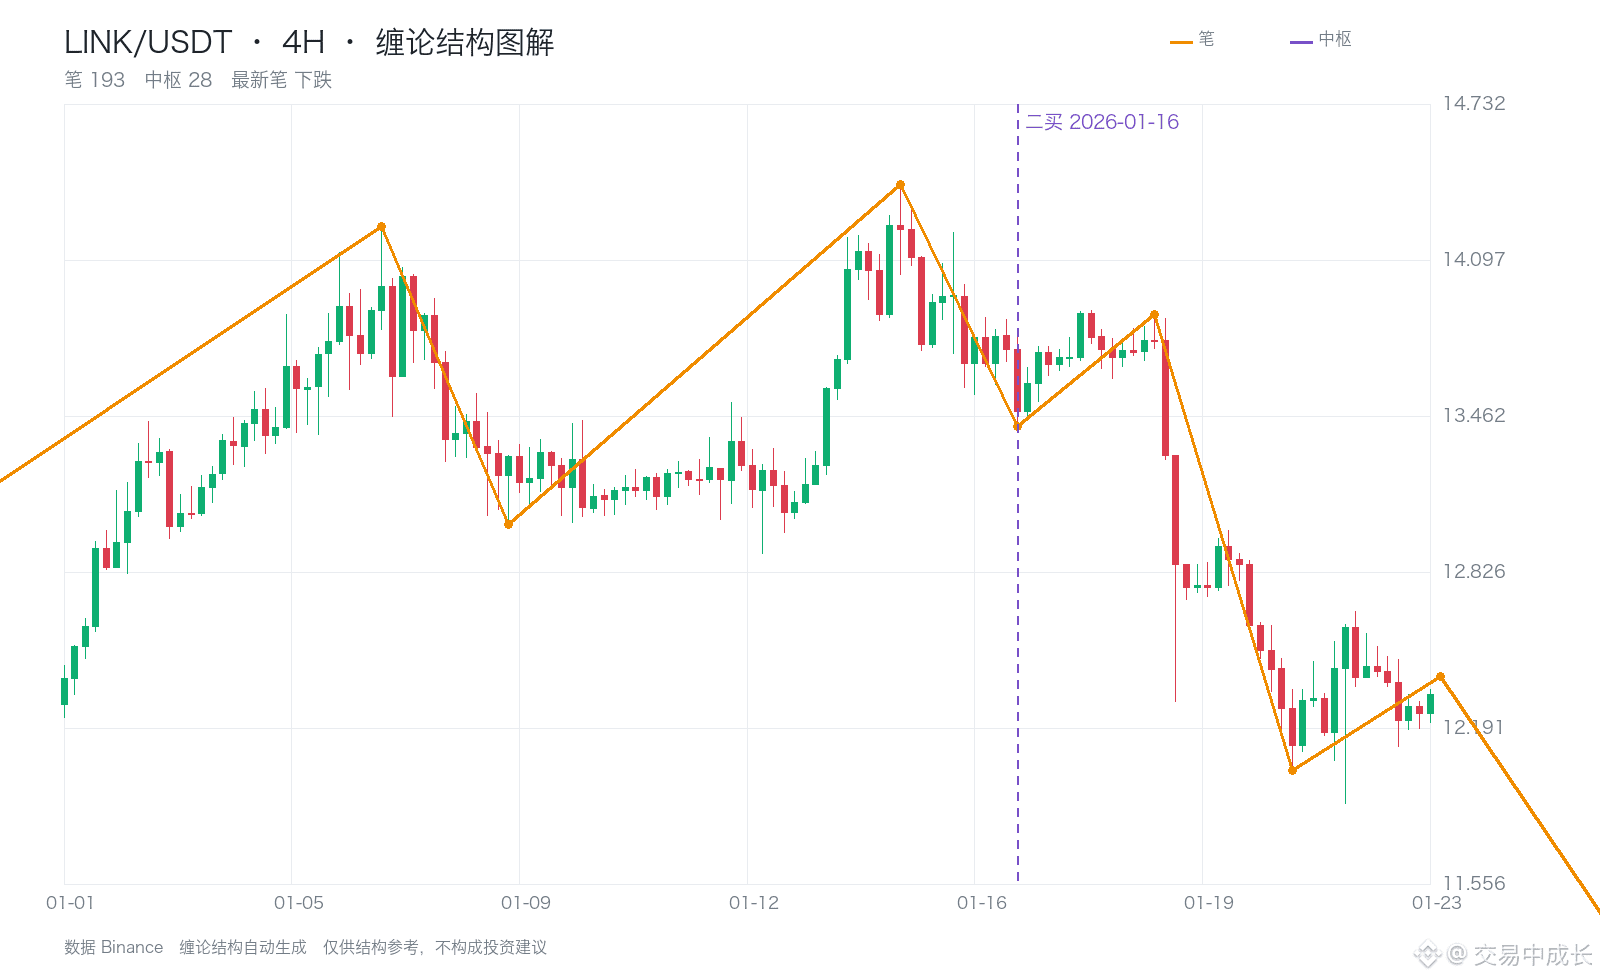
Looking back at a historical case: On January 16, 2026, the engine identified LINK’s 4h structure as a second buy.
The preceding first-buy marker price was 13.018, and the marker price of 13.418 was above this reference price.
Over the next 20 candlesticks, the price at one point moved against the signal to 12.300, with a maximum adverse excursion of 8.3% relative to the marker price. The closing price at the end of the window was 12.877.
This example reminds us that after seeing buy or sell point markers, we should also check the subsequent structure and invalidation conditions.
This is a retrospective structural review. The interval’s high and low prices are not the same as actual trading returns, nor do they mean the signal could have been confirmed at the time.
$LINK $BTC $ETH #缠论 #AnthropicIPO #BinanceUpdates
The preceding first-buy marker price was 13.018, and the marker price of 13.418 was above this reference price.
Over the next 20 candlesticks, the price at one point moved against the signal to 12.300, with a maximum adverse excursion of 8.3% relative to the marker price. The closing price at the end of the window was 12.877.
This example reminds us that after seeing buy or sell point markers, we should also check the subsequent structure and invalidation conditions.
This is a retrospective structural review. The interval’s high and low prices are not the same as actual trading returns, nor do they mean the signal could have been confirmed at the time.
$LINK $BTC $ETH #缠论 #AnthropicIPO #BinanceUpdates