🚀 AAVE (AAVE/USDT) – Is a Bullish Reversal Taking Shape?
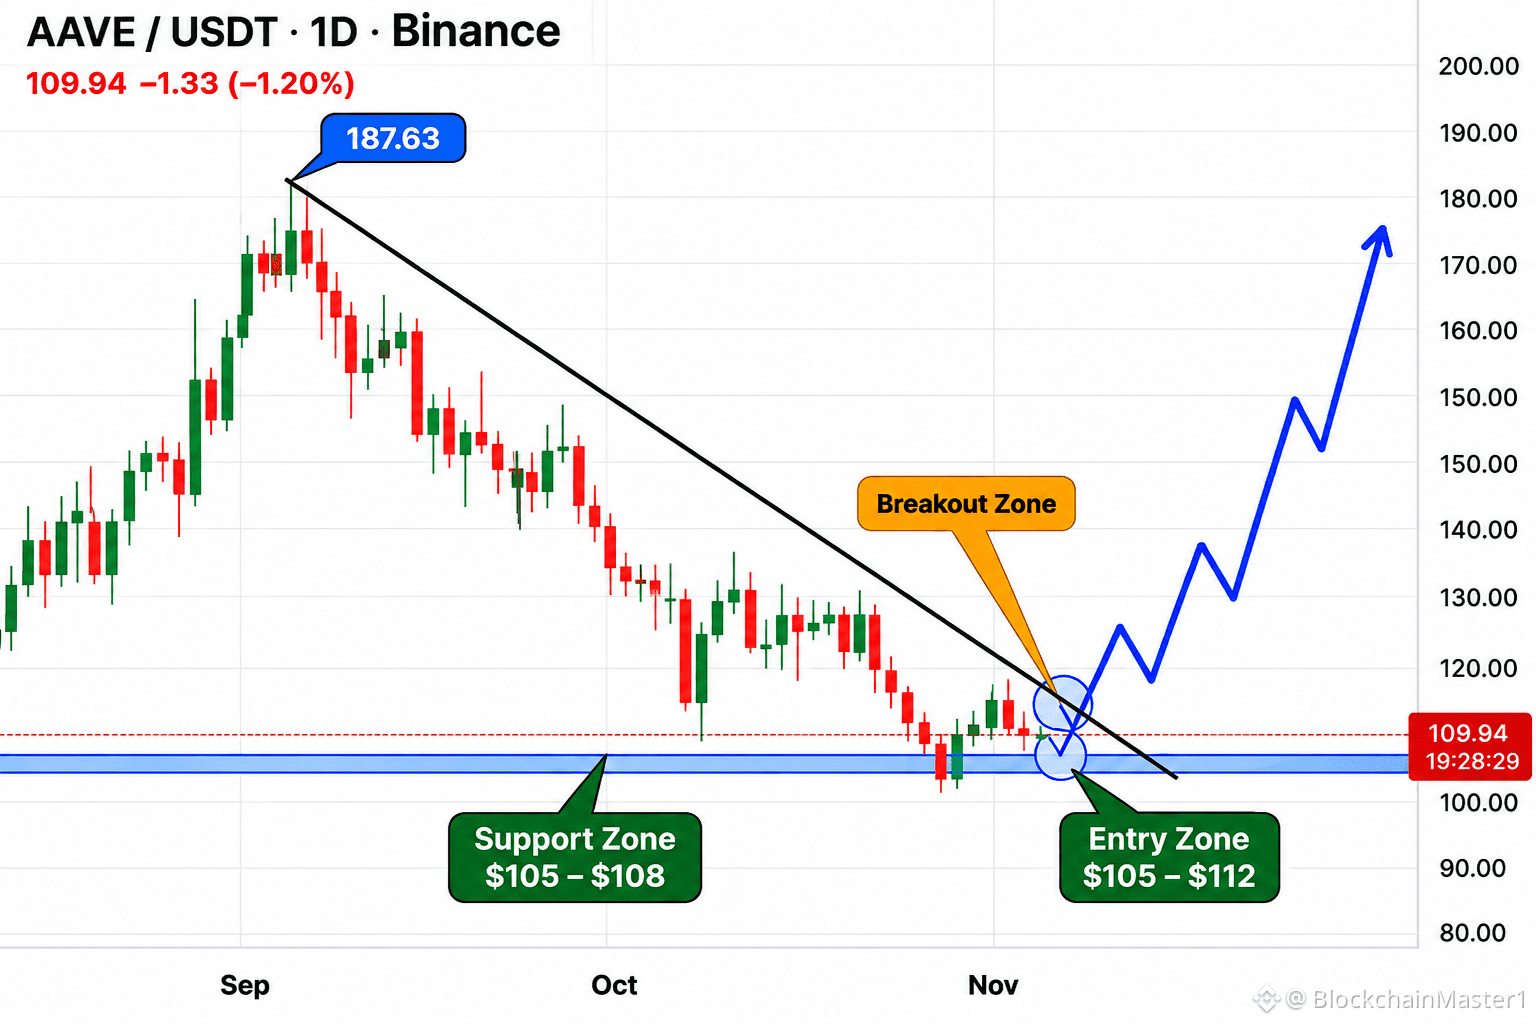
AAVE is trading near $109.94, down 1.11% in the snapshot. After a sustained decline, the daily chart shows price testing support around $105–$108. This zone could attract buyers, but confirmation is needed before calling a trend reversal.
📊 Market Overview:
• Current Price: $109.94
• Market Cap: $1.7B
• Fully Diluted Market Cap: $1.76B
• 24H Volume: $208.59M
• Market Rank: #37
• Circulating Supply: 15.44M AAVE
📈 Technical Outlook:
The chart shows a descending trendline pressing down on price. Holding $105–$108, followed by a move above $115–$120 resistance, would strengthen the bullish case. A confirmed breakout could open the way toward higher levels.
🎯 Potential Entry Zone: $105–$112
🎯 Take Profit Targets:
• TP1: $130
• TP2: $150
• TP3: $175
🛑 Risk Level: A daily close below $105 would weaken this setup. Manage position size carefully.
⚡ Bullish confirmation: rising volume and a daily close above resistance before entering any trade.
These are technical scenario levels, not guaranteed outcomes or financial advice. Manage risk carefully.
Can AAVE reclaim $150 in the next recovery?
#AAVE #Binance $AAVE $MMT $LUNC
AAVE is trading near $109.94, down 1.11% in the snapshot. After a sustained decline, the daily chart shows price testing support around $105–$108. This zone could attract buyers, but confirmation is needed before calling a trend reversal.
📊 Market Overview:
• Current Price: $109.94
• Market Cap: $1.7B
• Fully Diluted Market Cap: $1.76B
• 24H Volume: $208.59M
• Market Rank: #37
• Circulating Supply: 15.44M AAVE
📈 Technical Outlook:
The chart shows a descending trendline pressing down on price. Holding $105–$108, followed by a move above $115–$120 resistance, would strengthen the bullish case. A confirmed breakout could open the way toward higher levels.
🎯 Potential Entry Zone: $105–$112
🎯 Take Profit Targets:
• TP1: $130
• TP2: $150
• TP3: $175
🛑 Risk Level: A daily close below $105 would weaken this setup. Manage position size carefully.
⚡ Bullish confirmation: rising volume and a daily close above resistance before entering any trade.
These are technical scenario levels, not guaranteed outcomes or financial advice. Manage risk carefully.
Can AAVE reclaim $150 in the next recovery?
#AAVE #Binance $AAVE $MMT $LUNC