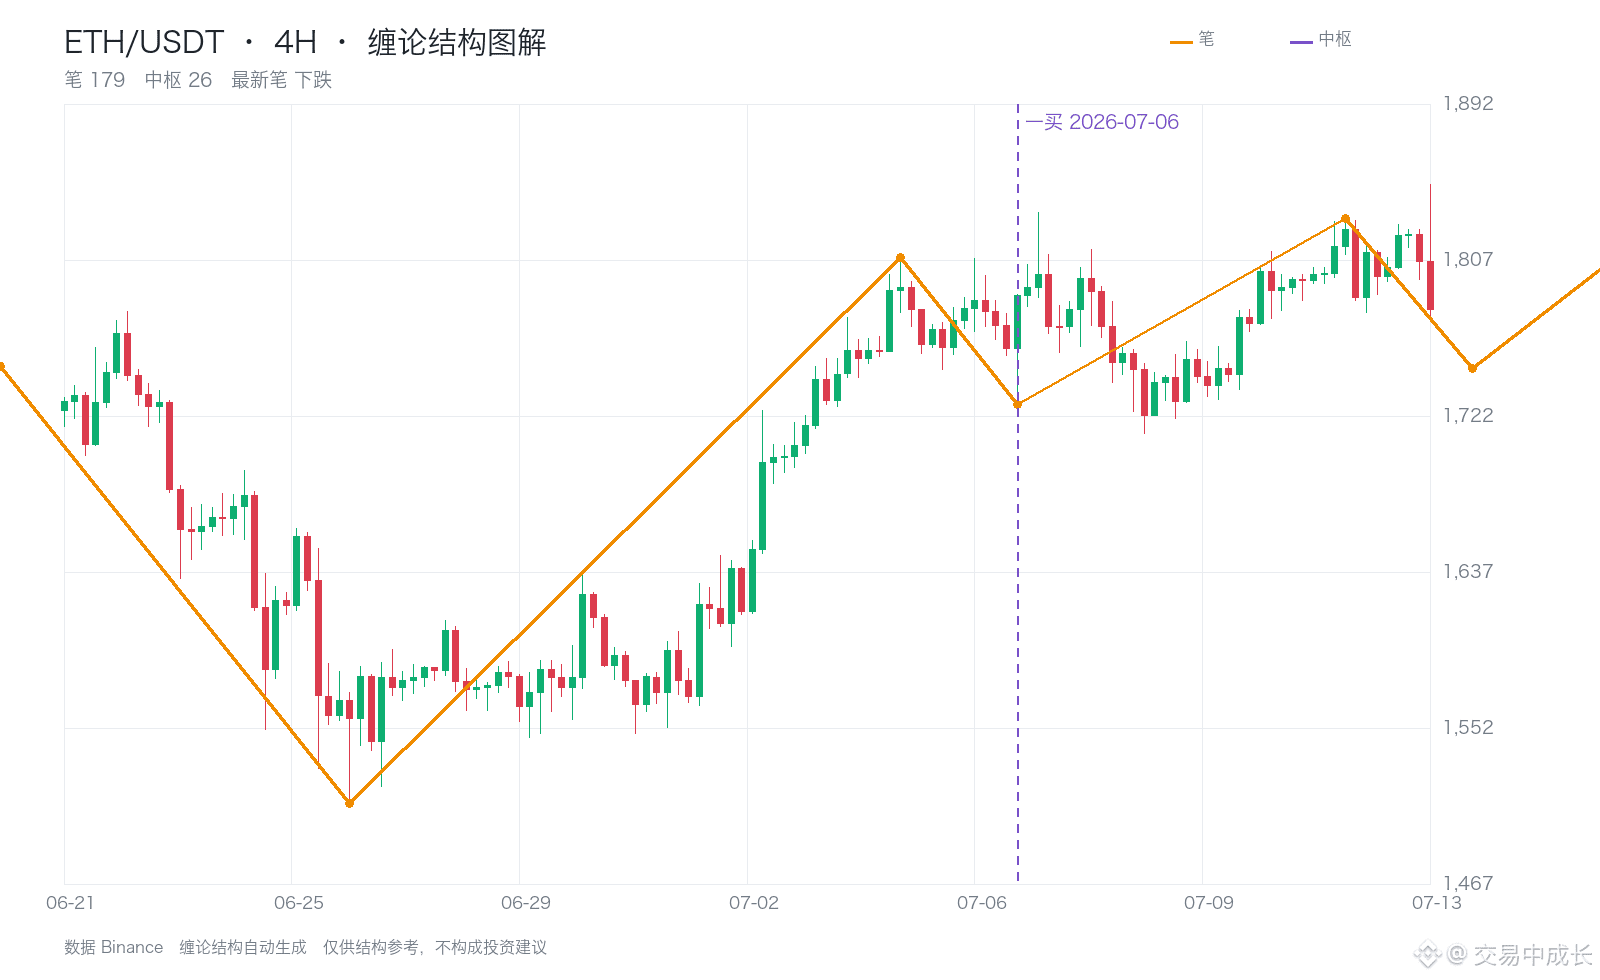
Review of a historical case: On July 6, 2026, the engine identified ETH's 4-hour structure as a first-buy point.
The lower boundary of the central zone associated with this first-buy signal was 1,602, and the marked price of 1,728 was above this reference price.
Over the next 20 candlesticks, the price reached a high of 1,833, giving a maximum favorable movement of 6.1% relative to the marked price. The closing price at the end of the window was 1,744.
When reviewing the case, also consider adverse price movements along the way; don't focus only on how much ground was ultimately covered.
This is a retrospective structural review. The period's high and low prices are not equivalent to actual trading returns, nor do they mean that the signal could have been confirmed at the time.
$ETH $BTC #缠论 #比特币行情 #Tether
The lower boundary of the central zone associated with this first-buy signal was 1,602, and the marked price of 1,728 was above this reference price.
Over the next 20 candlesticks, the price reached a high of 1,833, giving a maximum favorable movement of 6.1% relative to the marked price. The closing price at the end of the window was 1,744.
When reviewing the case, also consider adverse price movements along the way; don't focus only on how much ground was ultimately covered.
This is a retrospective structural review. The period's high and low prices are not equivalent to actual trading returns, nor do they mean that the signal could have been confirmed at the time.
$ETH $BTC #缠论 #比特币行情 #Tether