$ARB: When a Coin Decouples From Its Usual Peer Group: What to Check First
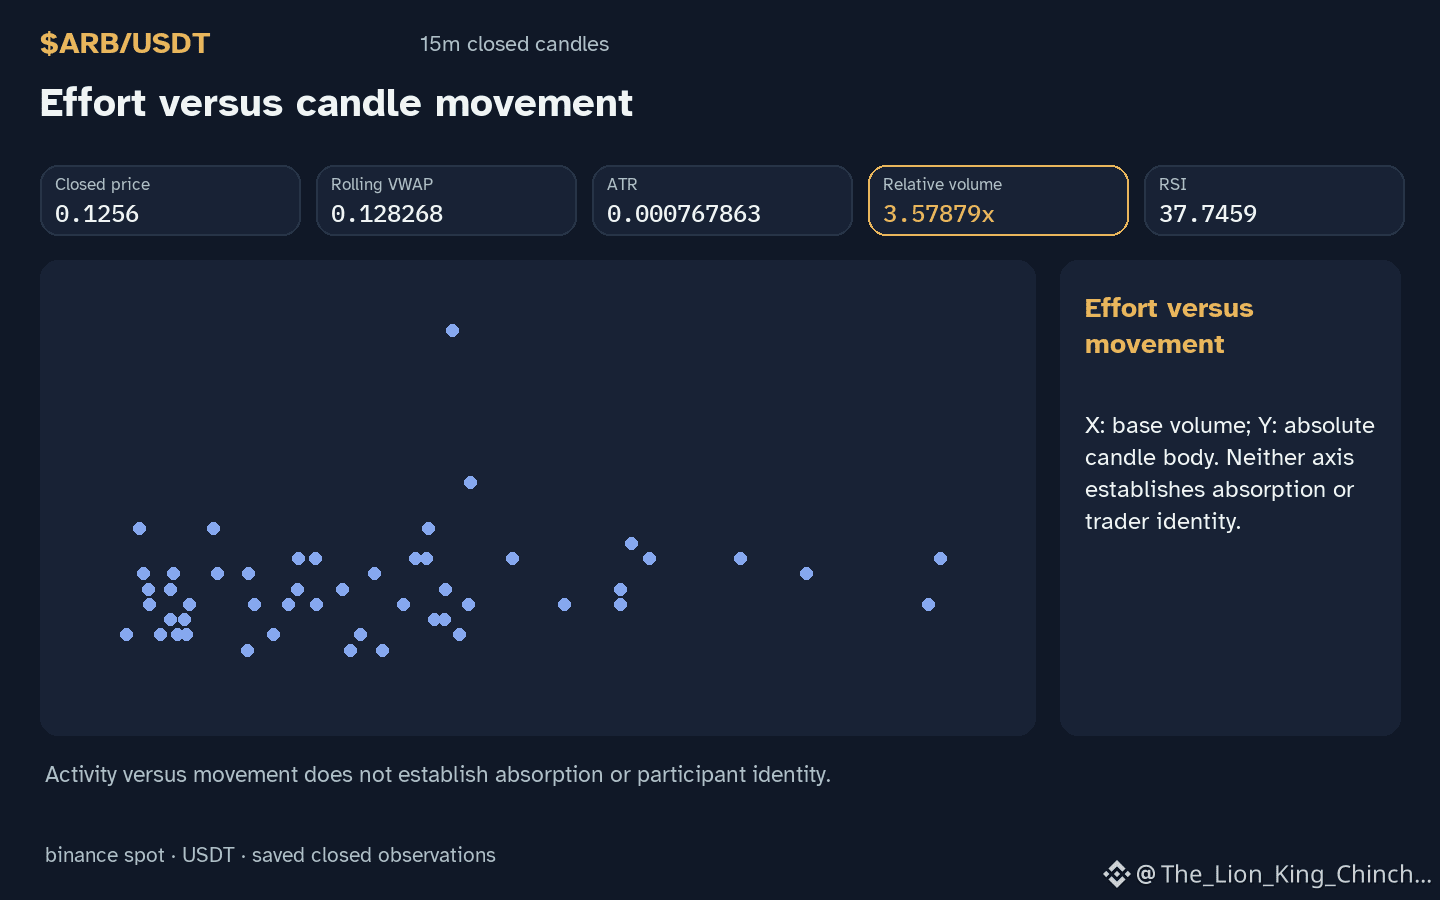
$ARB: ARB trades at 0.1256. Is the current regime shifting with volume above baseline? Direction alone is weak evidence for structural change.
Hypothetical Decision
A trader sees ARB move hourly down. They ask if volume confirms a break. If volume is not above baseline, the move may lack conviction. This is a thought experiment, not a claim about actual order flow.
Where the Analogy Helps
Comparing ARB to BTC and SENT clarifies limits. BTC moves down with volume not above baseline. SENT moves up with volume above baseline. These are separate observations. A shared or opposed direction does not prove correlation, capital rotation, or sector membership. It only shows distinct hourly states on the same venue.
Where the Analogy Fails
Volume ratios measure relative activity against preceding candles, not buying or selling pressure. RSI at 37.7 is an indicator reading, not a prediction. Candles and volume cannot confirm exhaustion, motives, or causation. The risk here is overfitting to a single bar. A counterexample is easy to find: an asset can drop with low volume for reasons unrelated to arbitrage or liquidation. Self-check the interpretation by waiting for a closed candle that closes below 0.1254 with volume above baseline. If that condition is not met, the shift hypothesis remains unverified. Do not treat current measurements as final proof of a new trend.
Probabilistic market research, not a recommendation or guaranteed return.
The comparison to keep in mind: $BTC has hourly direction down and volume not above its baseline; $SENT has hourly direction up and volume above its baseline. This alone does not establish correlation.
#ARB #BTC #SENT #CryptoWatchlist #CryptoLearning
$ARB: ARB trades at 0.1256. Is the current regime shifting with volume above baseline? Direction alone is weak evidence for structural change.
Hypothetical Decision
A trader sees ARB move hourly down. They ask if volume confirms a break. If volume is not above baseline, the move may lack conviction. This is a thought experiment, not a claim about actual order flow.
Where the Analogy Helps
Comparing ARB to BTC and SENT clarifies limits. BTC moves down with volume not above baseline. SENT moves up with volume above baseline. These are separate observations. A shared or opposed direction does not prove correlation, capital rotation, or sector membership. It only shows distinct hourly states on the same venue.
Where the Analogy Fails
Volume ratios measure relative activity against preceding candles, not buying or selling pressure. RSI at 37.7 is an indicator reading, not a prediction. Candles and volume cannot confirm exhaustion, motives, or causation. The risk here is overfitting to a single bar. A counterexample is easy to find: an asset can drop with low volume for reasons unrelated to arbitrage or liquidation. Self-check the interpretation by waiting for a closed candle that closes below 0.1254 with volume above baseline. If that condition is not met, the shift hypothesis remains unverified. Do not treat current measurements as final proof of a new trend.
Probabilistic market research, not a recommendation or guaranteed return.
The comparison to keep in mind: $BTC has hourly direction down and volume not above its baseline; $SENT has hourly direction up and volume above its baseline. This alone does not establish correlation.
#ARB #BTC #SENT #CryptoWatchlist #CryptoLearning