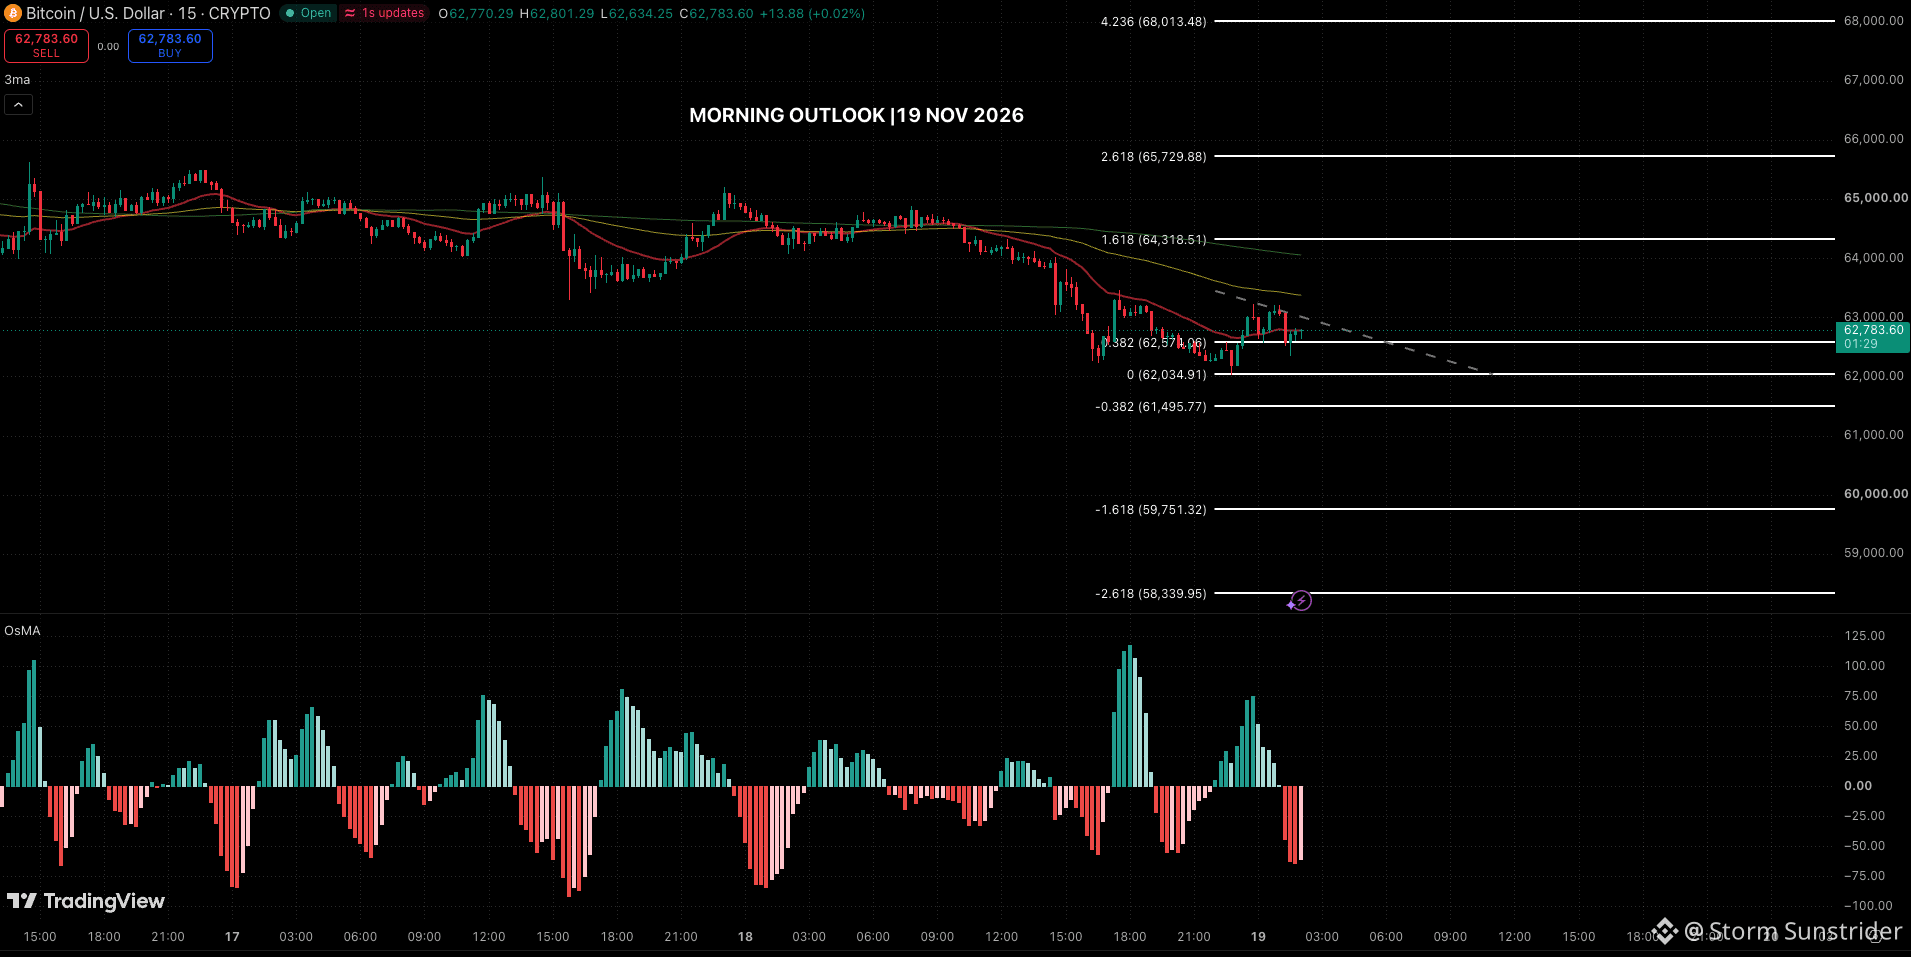
📊 MORNING VIEW | 19/11/2026
BTC/USD · Timeframe M15 | TradingView
📊 MARKET OVERVIEW
Bitcoin is declining again today, in line with the bearish analysis I shared yesterday.
Technically, the Moving Average (MA) indicator continues to show a downtrend, indicating that sellers still dominate the market.
However, after touching the 62.034 area, BTC managed to move back above Fibonacci 0.382 at 62.574. This opens the possibility of a technical rebound before the price potentially resumes its bearish trend.
🎯 KEY PRICE LEVELS
🟢 62.574 | Nearest support (Fib 0.382)
🟢 62.034 | Major support (Fib 0)
🔴 64.318 | Rebound target (Fib 1.618)
🔻 61.495 | Next support (Fib -0.382)
🔻 59.751 | Bearish target (Fib -1.618)
🔻 58.339 | Extended bearish target (Fib -2.618)
📈 TRADING SCENARIOS
🟢 LONG (Technical Rebound)
As long as BTC holds above 62.574 and shows bullish confirmation, a rebound toward 64.318 remains possible.
Target: 64.318
Invalidation: Price breaks back below 62.034.
🔴 SHORT (Bearish Continuation)
If BTC rebounds but fails to break through the 64.318 resistance, the price may resume its downtrend.
Target 1: 62.034
Target 2: 61.495
Target 3: 59.751
Extended Target: 58.339
Invalidation: Price breaks out and holds above 64.318.
📌 ANALYST'S VIEW
Overall, I am maintaining a bearish bias on BTC. However, price declines do not always happen without a correction.
BTC's ability to move above Fibonacci 0.382 creates the possibility of a rebound toward 64.318. However, until the trend structure changes, I still consider this rise a temporary correction.
Today's priority: Wait for a potential rebound first before looking for confirmation of the bearish trend's continuation.
Trade the confirmation, not the expectation.
BTC/USD · Timeframe M15 | TradingView
📊 MARKET OVERVIEW
Bitcoin is declining again today, in line with the bearish analysis I shared yesterday.
Technically, the Moving Average (MA) indicator continues to show a downtrend, indicating that sellers still dominate the market.
However, after touching the 62.034 area, BTC managed to move back above Fibonacci 0.382 at 62.574. This opens the possibility of a technical rebound before the price potentially resumes its bearish trend.
🎯 KEY PRICE LEVELS
🟢 62.574 | Nearest support (Fib 0.382)
🟢 62.034 | Major support (Fib 0)
🔴 64.318 | Rebound target (Fib 1.618)
🔻 61.495 | Next support (Fib -0.382)
🔻 59.751 | Bearish target (Fib -1.618)
🔻 58.339 | Extended bearish target (Fib -2.618)
📈 TRADING SCENARIOS
🟢 LONG (Technical Rebound)
As long as BTC holds above 62.574 and shows bullish confirmation, a rebound toward 64.318 remains possible.
Target: 64.318
Invalidation: Price breaks back below 62.034.
🔴 SHORT (Bearish Continuation)
If BTC rebounds but fails to break through the 64.318 resistance, the price may resume its downtrend.
Target 1: 62.034
Target 2: 61.495
Target 3: 59.751
Extended Target: 58.339
Invalidation: Price breaks out and holds above 64.318.
📌 ANALYST'S VIEW
Overall, I am maintaining a bearish bias on BTC. However, price declines do not always happen without a correction.
BTC's ability to move above Fibonacci 0.382 creates the possibility of a rebound toward 64.318. However, until the trend structure changes, I still consider this rise a temporary correction.
Today's priority: Wait for a potential rebound first before looking for confirmation of the bearish trend's continuation.
Trade the confirmation, not the expectation.