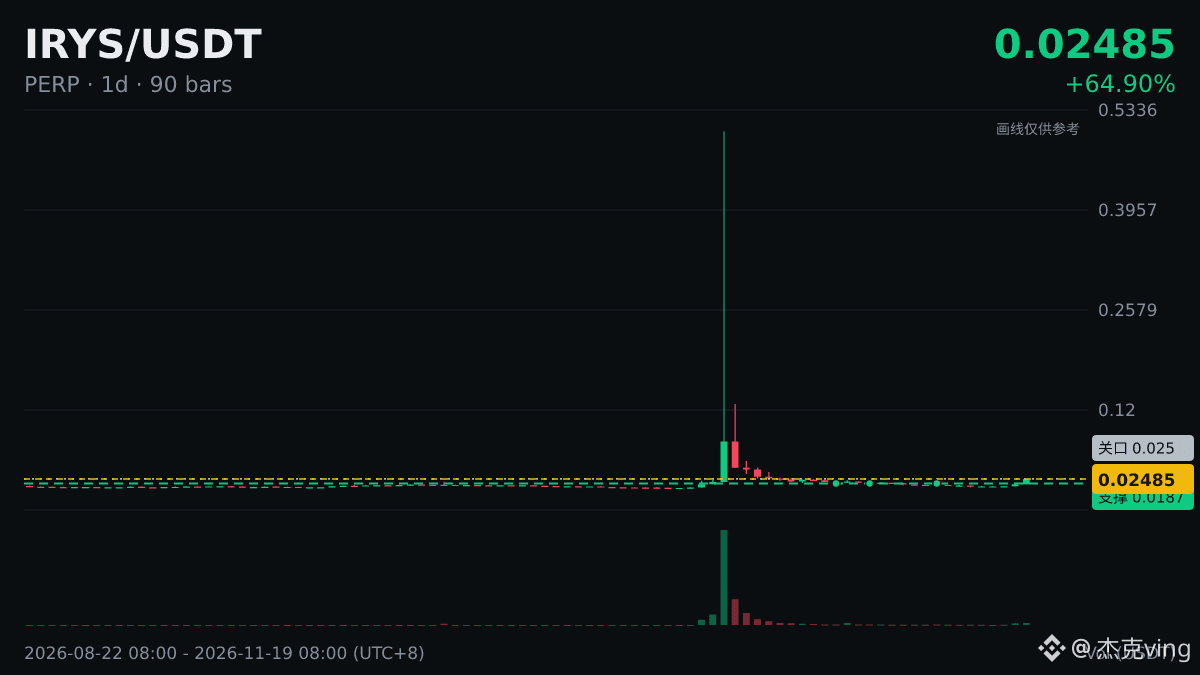
Let’s talk about the MACD golden cross on the daily chart for $IRYS . First, let’s be clear about two limitations of the indicator:
First, it lags. MACD is calculated using moving averages, so by the time a golden cross appears, the price has usually already risen some way from its low (up +67.67% in the past 24 hours).
Second, it struggles in choppy markets. In a sideways market, golden crosses and death crosses can appear repeatedly, creating a lot of noise.
Before this crossover, the opposing histogram bars persisted for 21 daily candles. The one-way move was not especially short, so this crossover looks cleaner than one in a sideways market. And since it is below the zero line, treat it as a rebound for now.
First, it lags. MACD is calculated using moving averages, so by the time a golden cross appears, the price has usually already risen some way from its low (up +67.67% in the past 24 hours).
Second, it struggles in choppy markets. In a sideways market, golden crosses and death crosses can appear repeatedly, creating a lot of noise.
Before this crossover, the opposing histogram bars persisted for 21 daily candles. The one-way move was not especially short, so this crossover looks cleaner than one in a sideways market. And since it is below the zero line, treat it as a rebound for now.