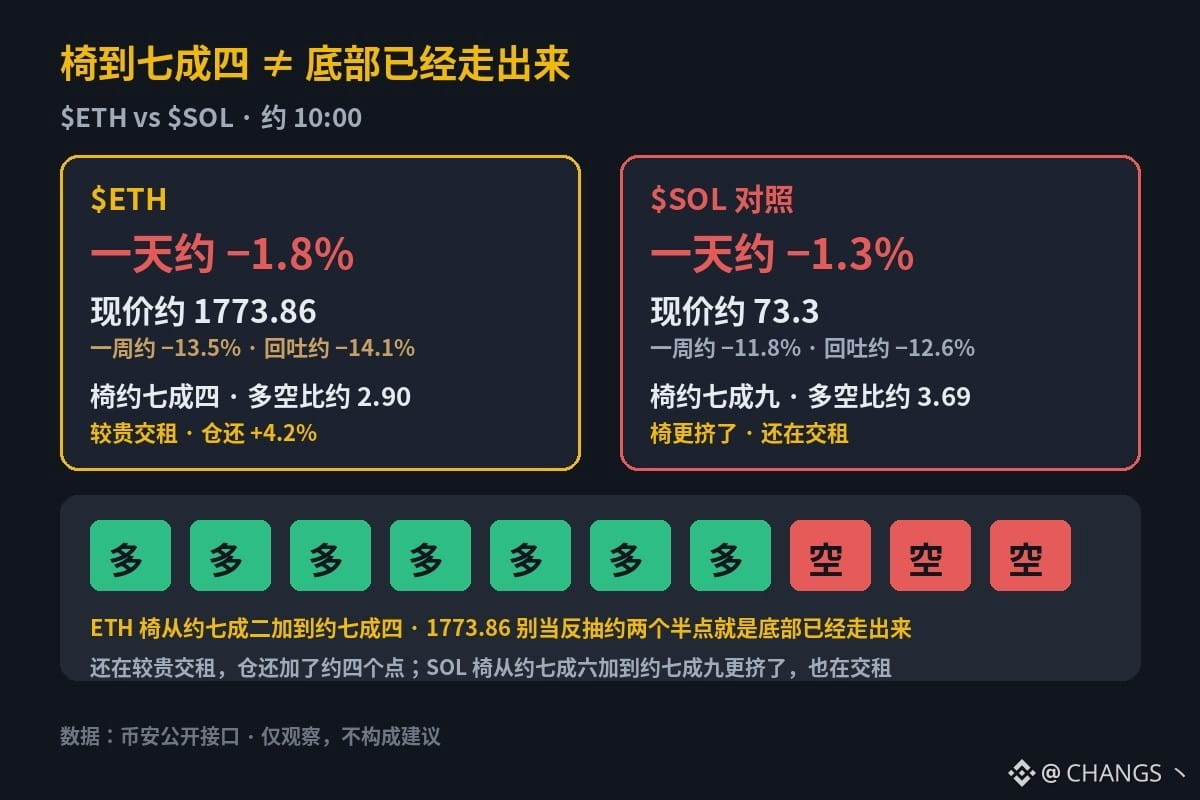
On Thursday morning, the broader market was still grinding near its lows for the past few months. Some took Ethereum’s roughly 2.5-point bounce from its intraday low, longs rising to around 74% while still paying relatively expensive funding, as proof that it was holding up better and had found shelter—that the bottom was in. The numbers tell a different story: on one side, longs rose from around 72% to 74%, still paying relatively expensive funding, open interest also rose by about four points, and price is still near its weekly lows; on the other, longs rose from around 76% to 79%, making the trade even more crowded, while still paying funding and sitting near weekly lows.
$ETH: down around 1.8% on the day and 13.5% on the week, with the current price around 1773.86. The weekly high was around 2064.58, a pullback of about 14.1%. The account long/short ratio is around 2.90 (about 74% long; around 2.54/72% about a day ago, with longs adding). Funding is relatively expensive at about +0.0094%/8h, so longs are paying to hold; OI is up around 4.2% over the past day (USDT-margined OI up around 3.2%, meaning positions are genuinely being added). Price slid from an intraday high around 1818.92, dipped to around 1731.42 during the day, and remains near its weekly lows. Longs rose from around 72% to 74% while still paying relatively expensive funding, and positions increased by about four points—so don’t take 1773.86, a roughly 2.5-point bounce from the intraday low and longs rising to around 74%, as proof that the bottom is in. And don’t mistake relatively expensive funding and rising positions for evidence that the market has found shelter.
Meanwhile, $SOL is down around 1.3% on the day and 11.8% on the week, with the current price around 73.3. Its weekly high was around 83.9, a pullback of about 12.6%. Longs are around 79% (long/short ratio around 3.69; around 3.25/76% about a day ago, with longs adding). Funding is around +0.0040%/8h, so longs are paying to hold; OI is down around 0.8% over the past day (USDT-margined OI down around 1.5%, with a slight reduction in contract count). Price slid from an intraday high around 75.6, dipped to around 72.16 during the day, and remains near its weekly lows. Longs rose from around 76% to 79%, making the trade even more crowded, while still paying funding.
On one side, longs rose from around 72% to 74%, still paying relatively expensive funding, positions increased by about four points, and price is still near its weekly lows; on the other, longs rose from around 76% to 79%, making the trade even more crowded, while also paying funding and sitting near weekly lows. Is this a roughly 2.5-point bounce from the intraday low, with longs rising to around 74%, proof that the bottom is in and shelter has been found—or is price simply bouncing partway, with one side crowded at around 74% while still paying relatively expensive funding and adding positions, and the other even more crowded at around 79% while also paying funding? Post counterexamples in the comments.
$ETH: down around 1.8% on the day and 13.5% on the week, with the current price around 1773.86. The weekly high was around 2064.58, a pullback of about 14.1%. The account long/short ratio is around 2.90 (about 74% long; around 2.54/72% about a day ago, with longs adding). Funding is relatively expensive at about +0.0094%/8h, so longs are paying to hold; OI is up around 4.2% over the past day (USDT-margined OI up around 3.2%, meaning positions are genuinely being added). Price slid from an intraday high around 1818.92, dipped to around 1731.42 during the day, and remains near its weekly lows. Longs rose from around 72% to 74% while still paying relatively expensive funding, and positions increased by about four points—so don’t take 1773.86, a roughly 2.5-point bounce from the intraday low and longs rising to around 74%, as proof that the bottom is in. And don’t mistake relatively expensive funding and rising positions for evidence that the market has found shelter.
Meanwhile, $SOL is down around 1.3% on the day and 11.8% on the week, with the current price around 73.3. Its weekly high was around 83.9, a pullback of about 12.6%. Longs are around 79% (long/short ratio around 3.69; around 3.25/76% about a day ago, with longs adding). Funding is around +0.0040%/8h, so longs are paying to hold; OI is down around 0.8% over the past day (USDT-margined OI down around 1.5%, with a slight reduction in contract count). Price slid from an intraday high around 75.6, dipped to around 72.16 during the day, and remains near its weekly lows. Longs rose from around 76% to 79%, making the trade even more crowded, while still paying funding.
On one side, longs rose from around 72% to 74%, still paying relatively expensive funding, positions increased by about four points, and price is still near its weekly lows; on the other, longs rose from around 76% to 79%, making the trade even more crowded, while also paying funding and sitting near weekly lows. Is this a roughly 2.5-point bounce from the intraday low, with longs rising to around 74%, proof that the bottom is in and shelter has been found—or is price simply bouncing partway, with one side crowded at around 74% while still paying relatively expensive funding and adding positions, and the other even more crowded at around 79% while also paying funding? Post counterexamples in the comments.