Trading Outlook | 11/19 08:20
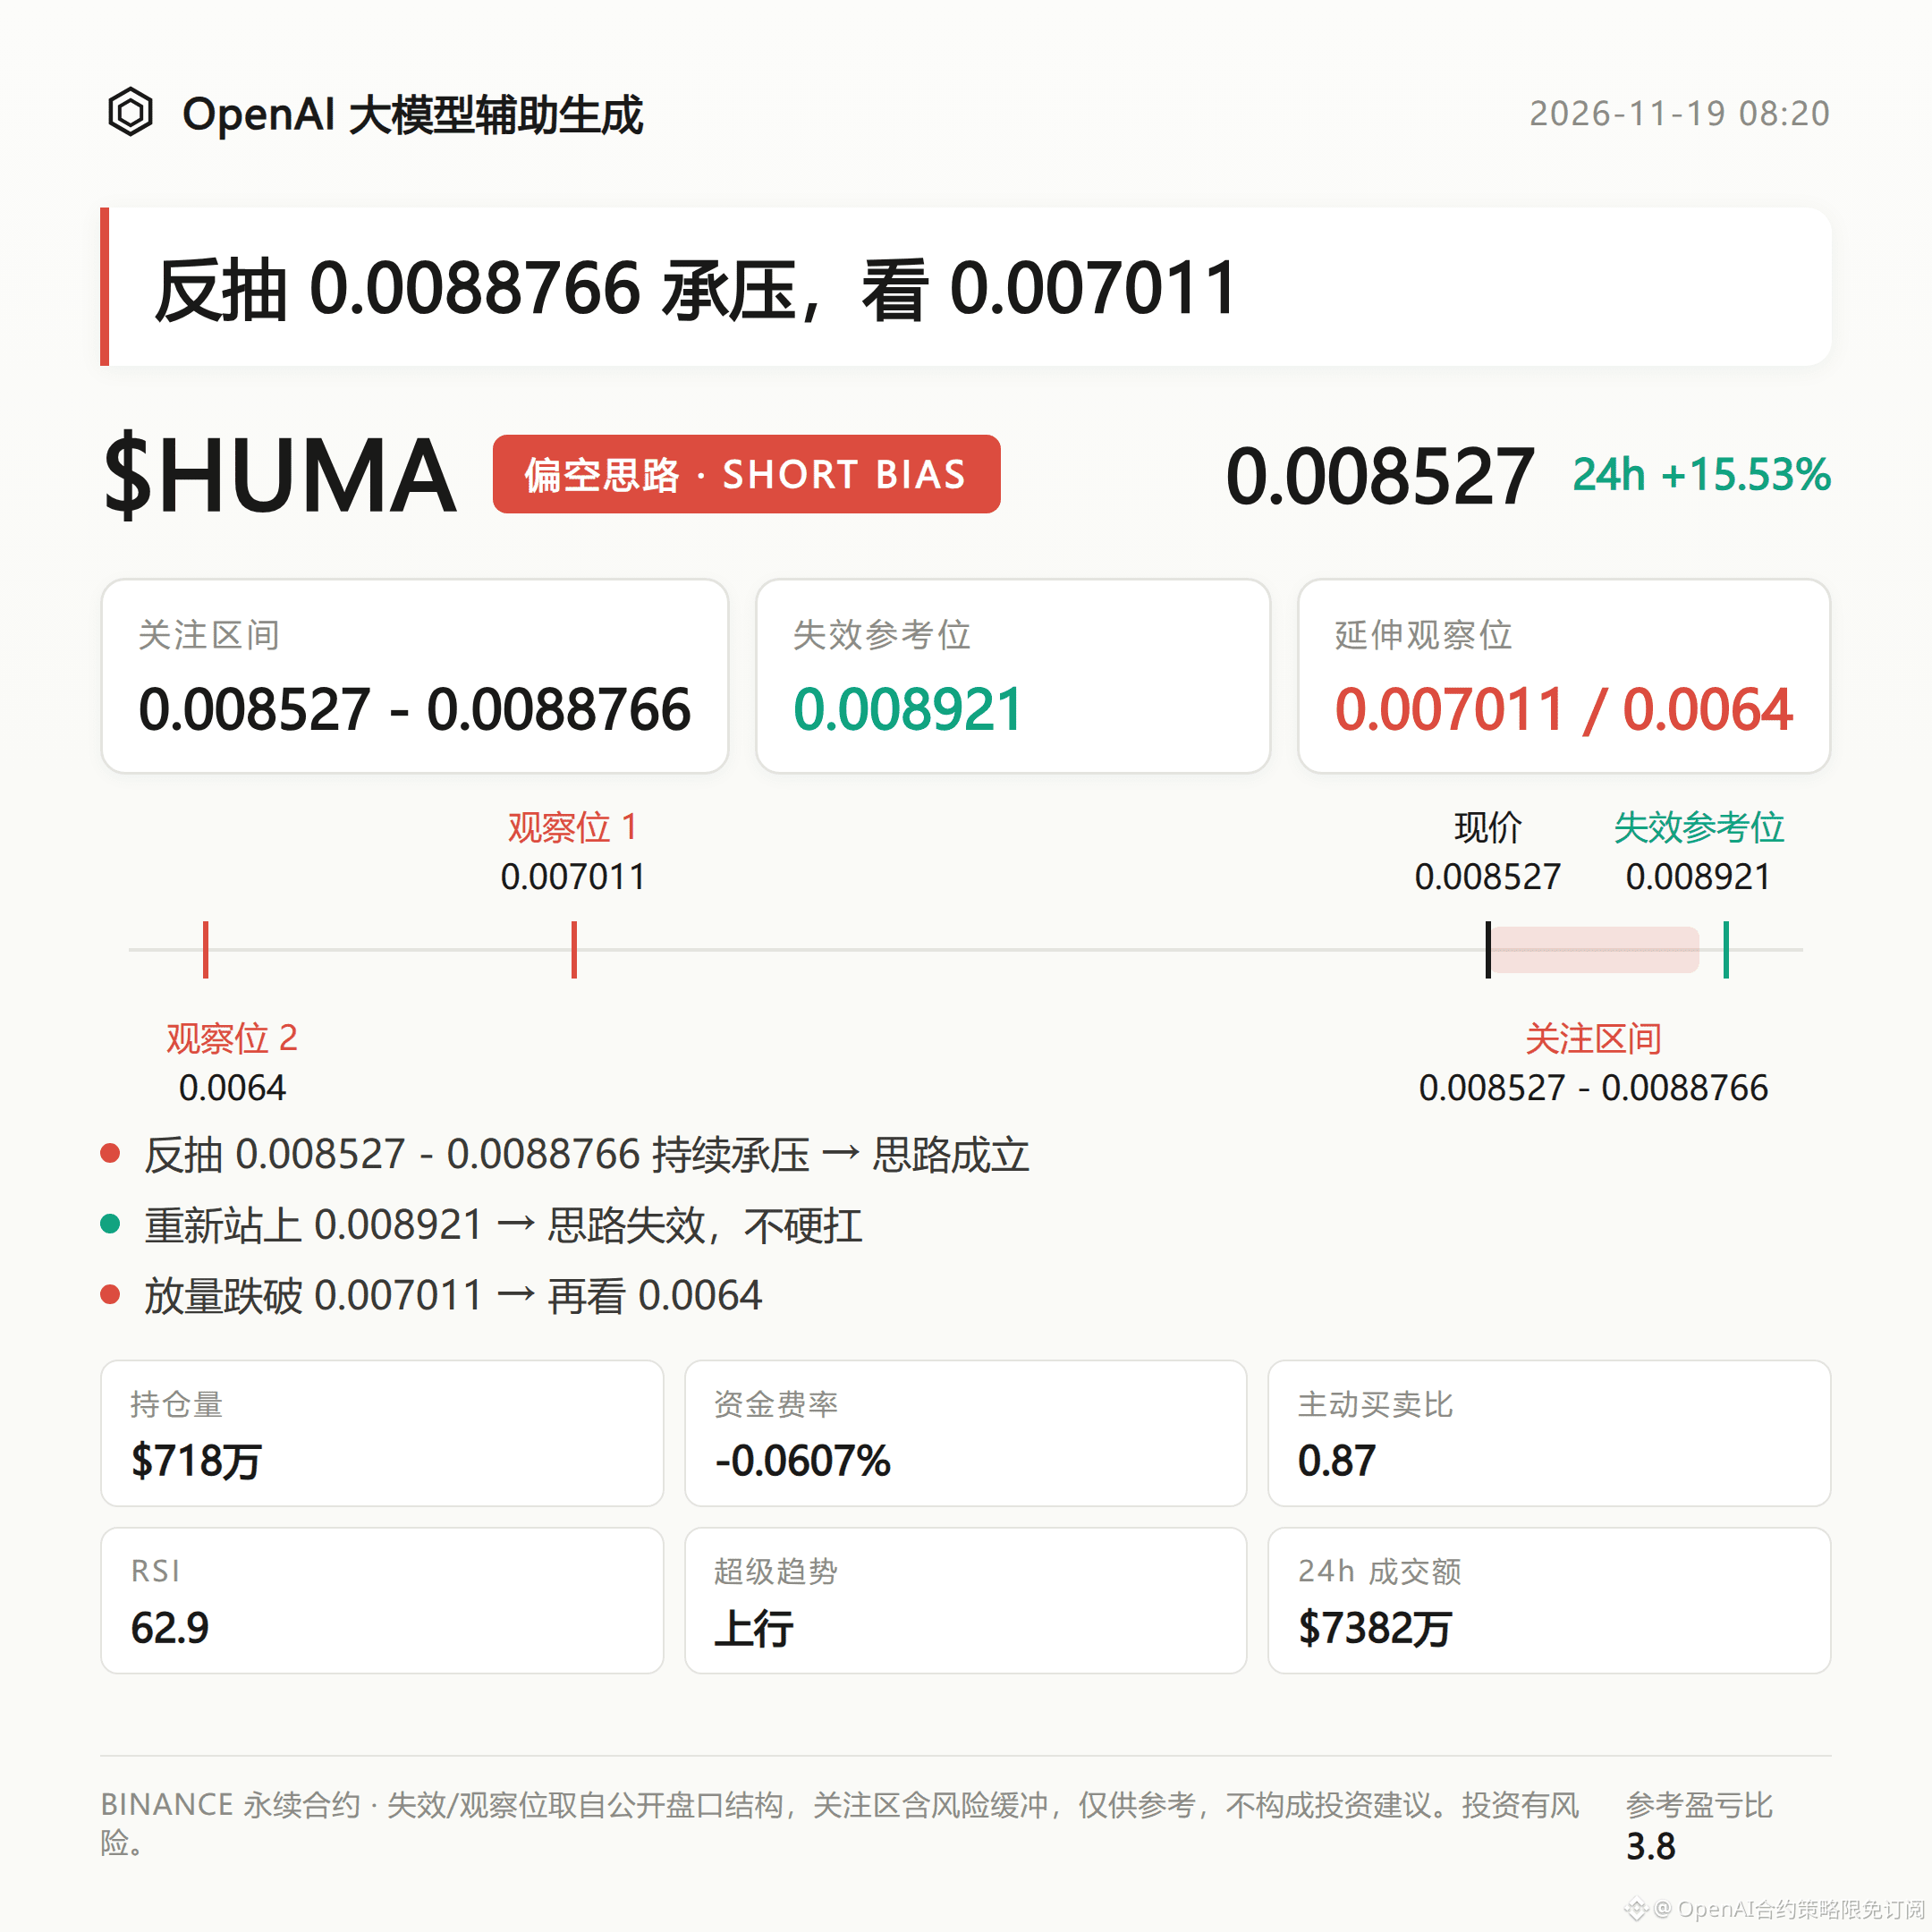
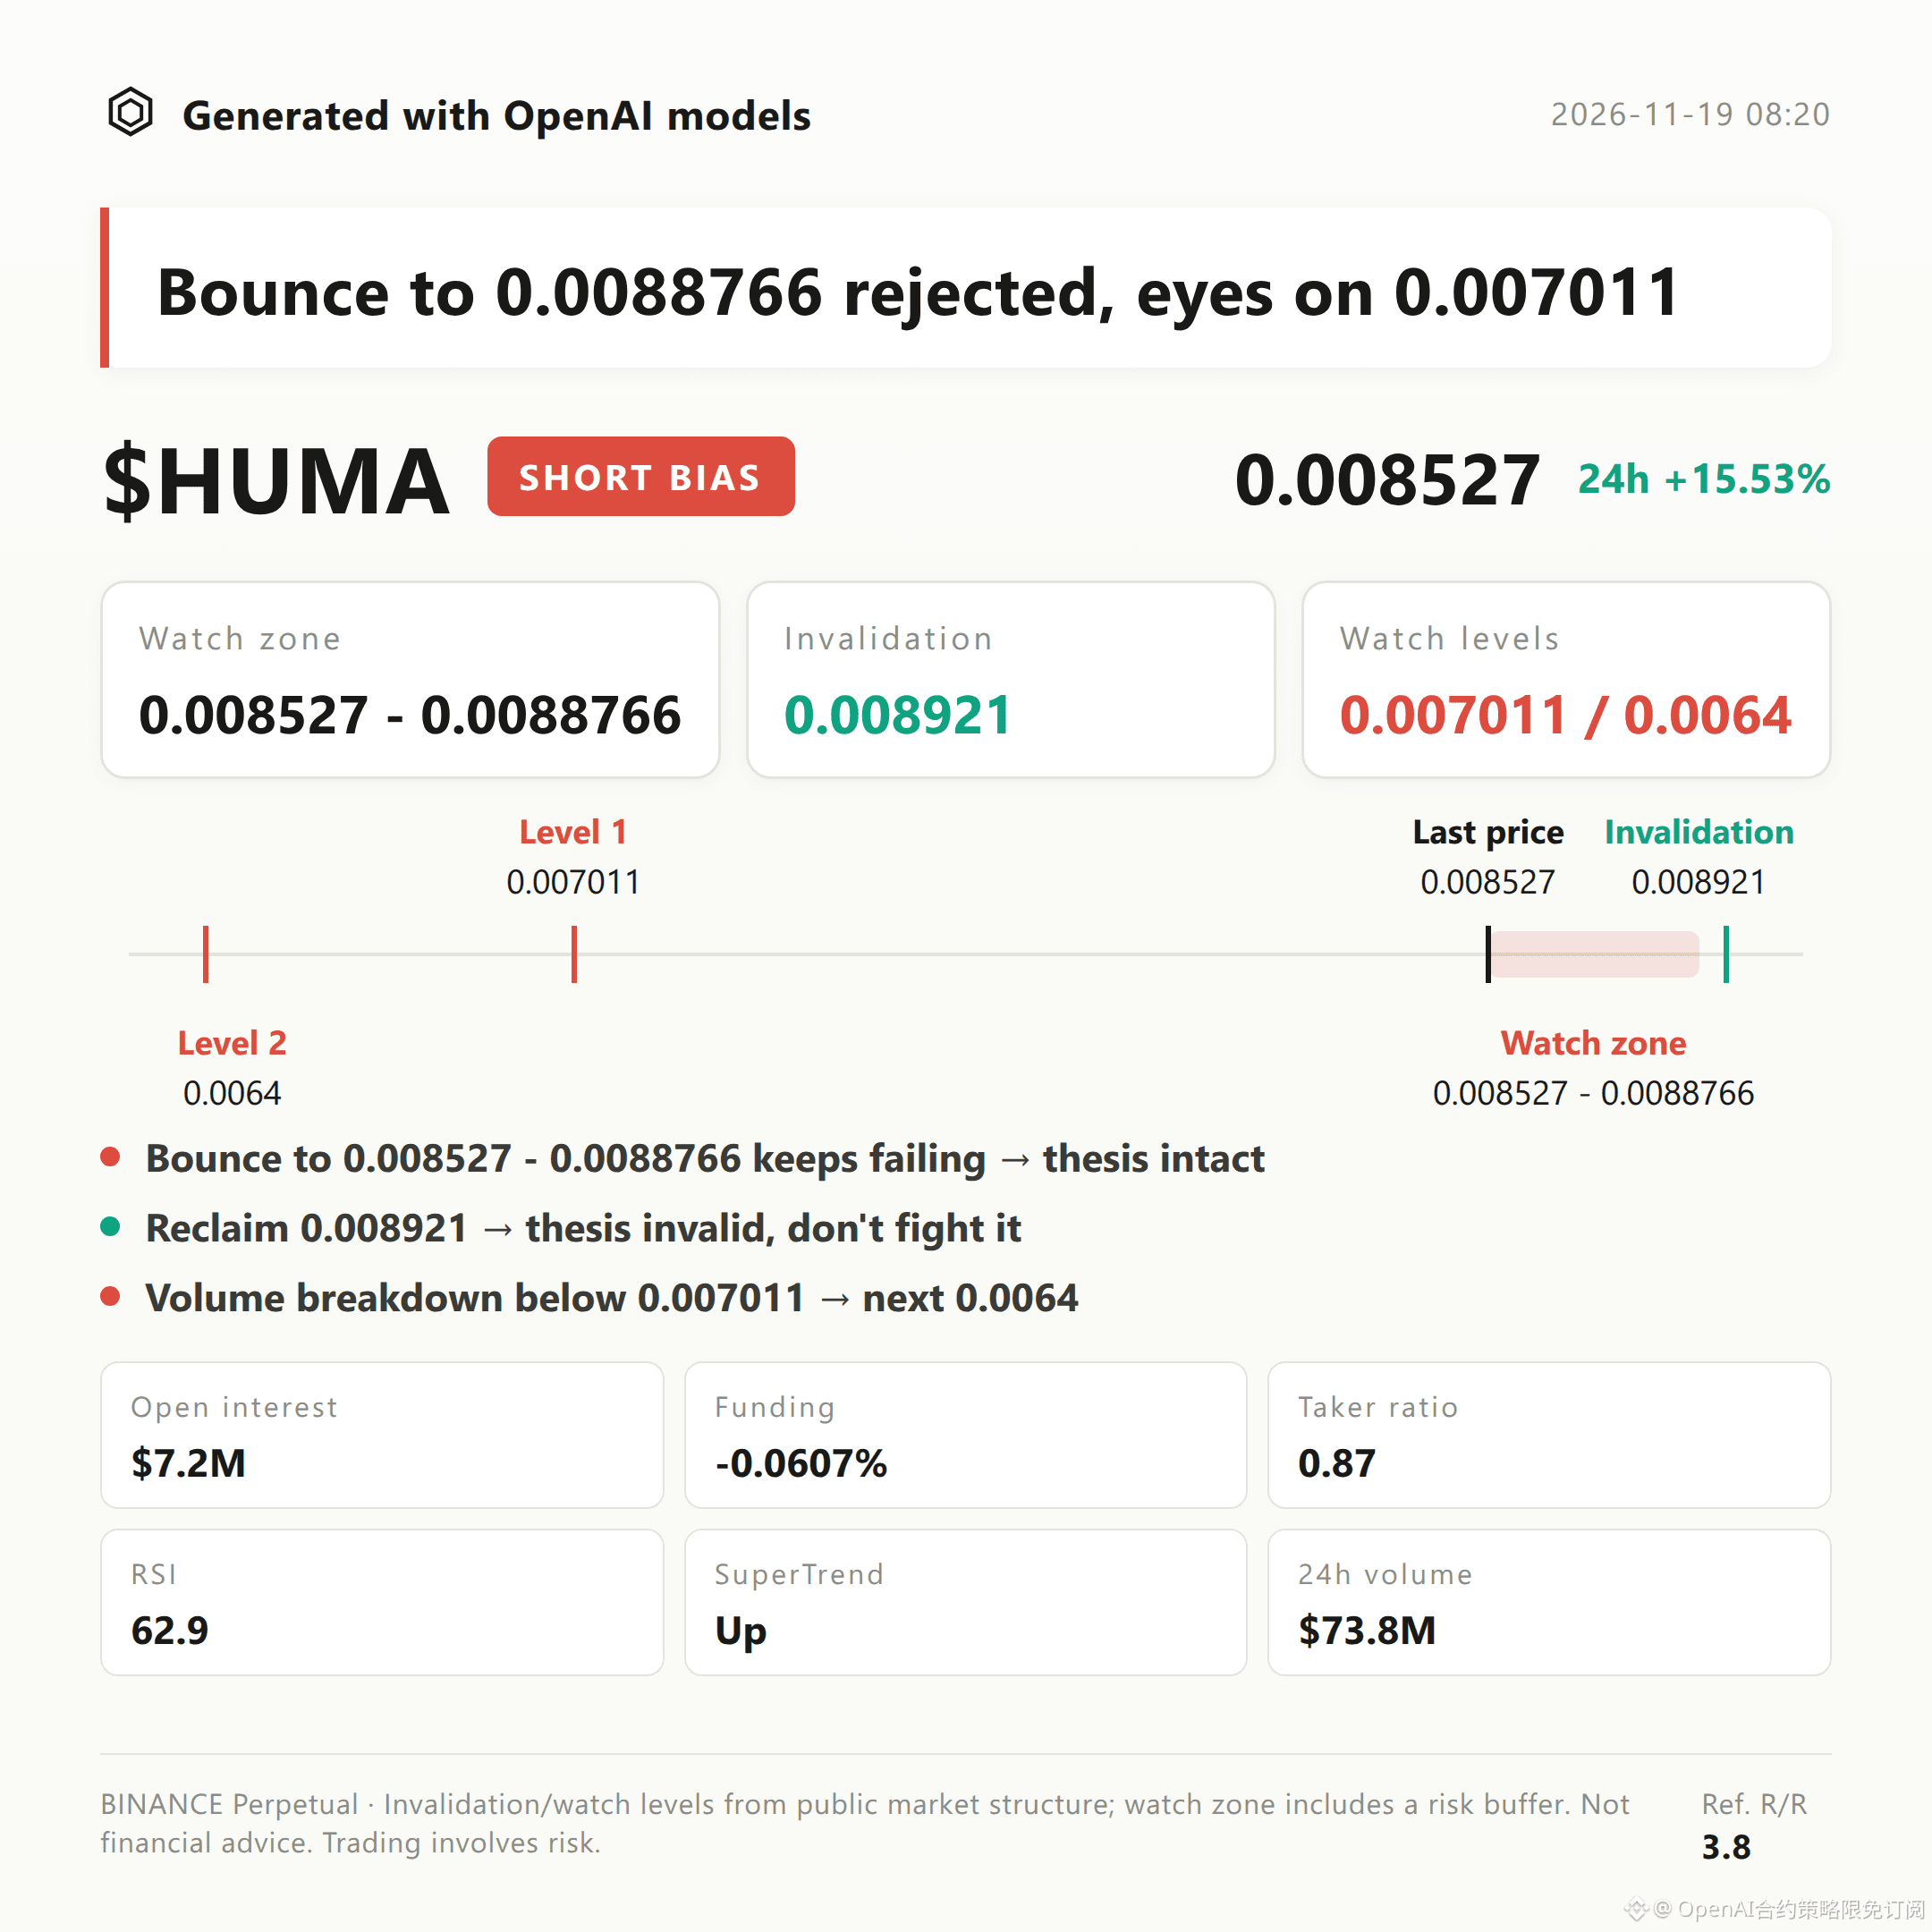
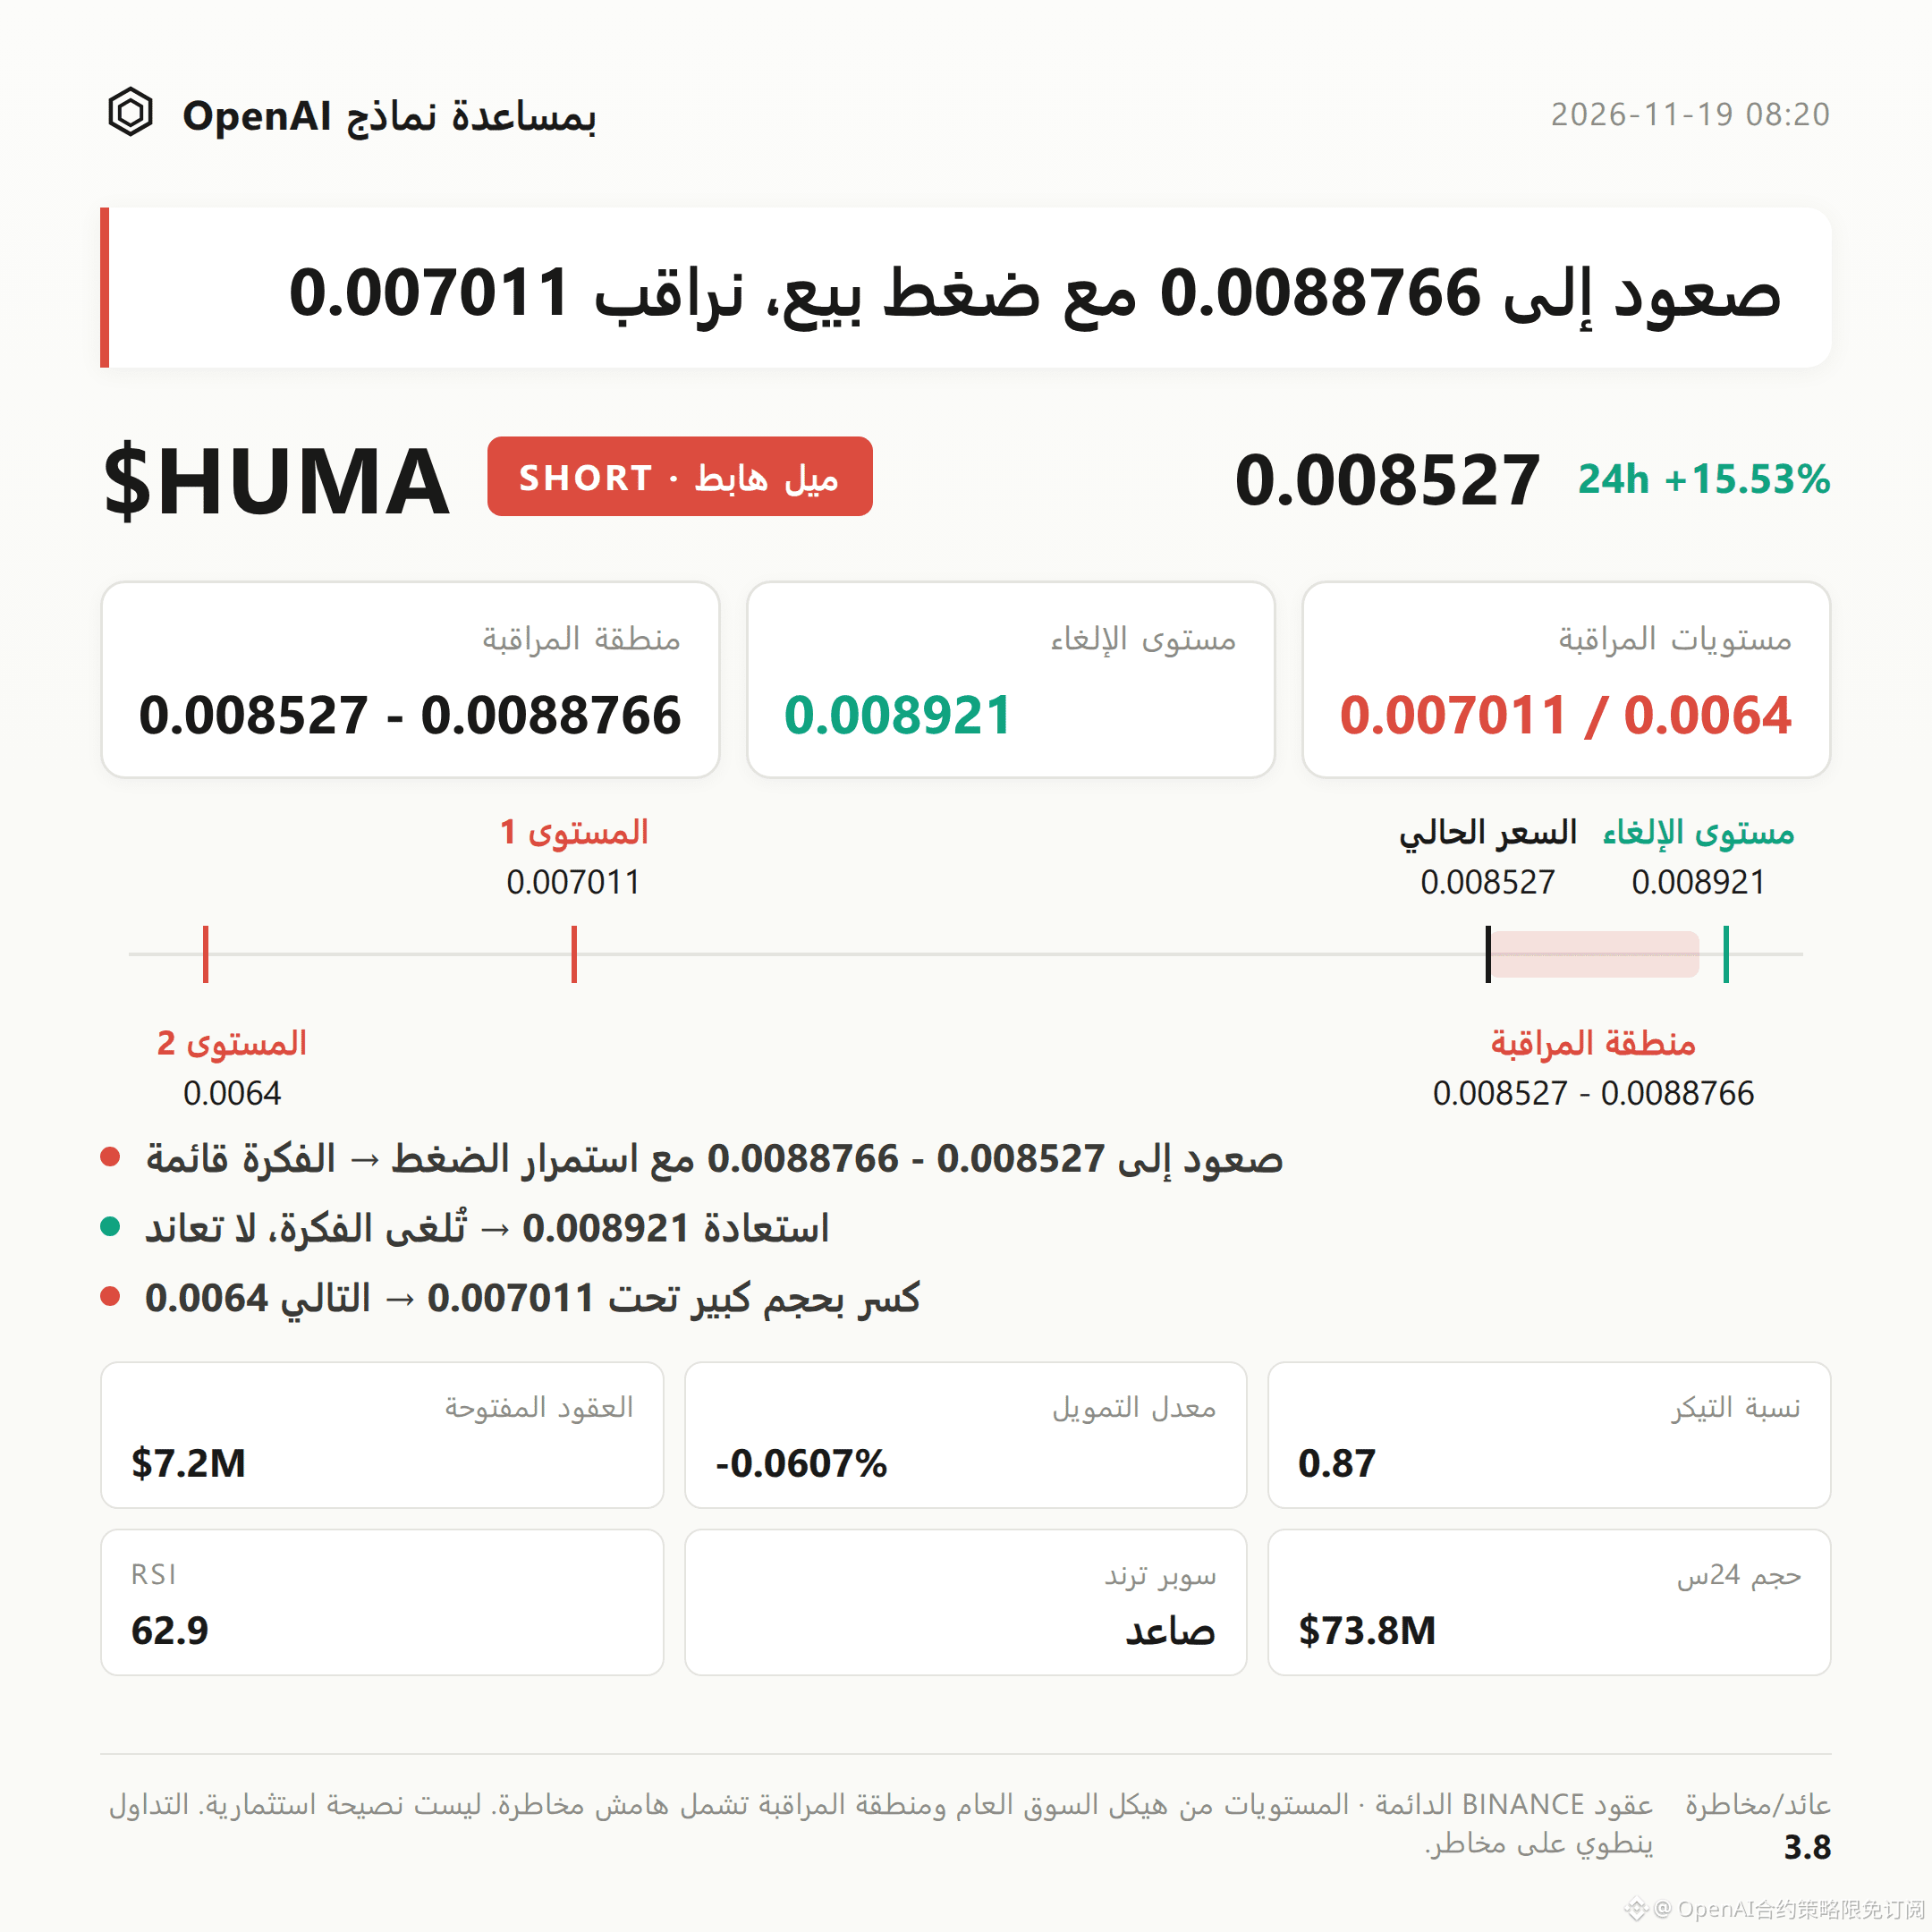
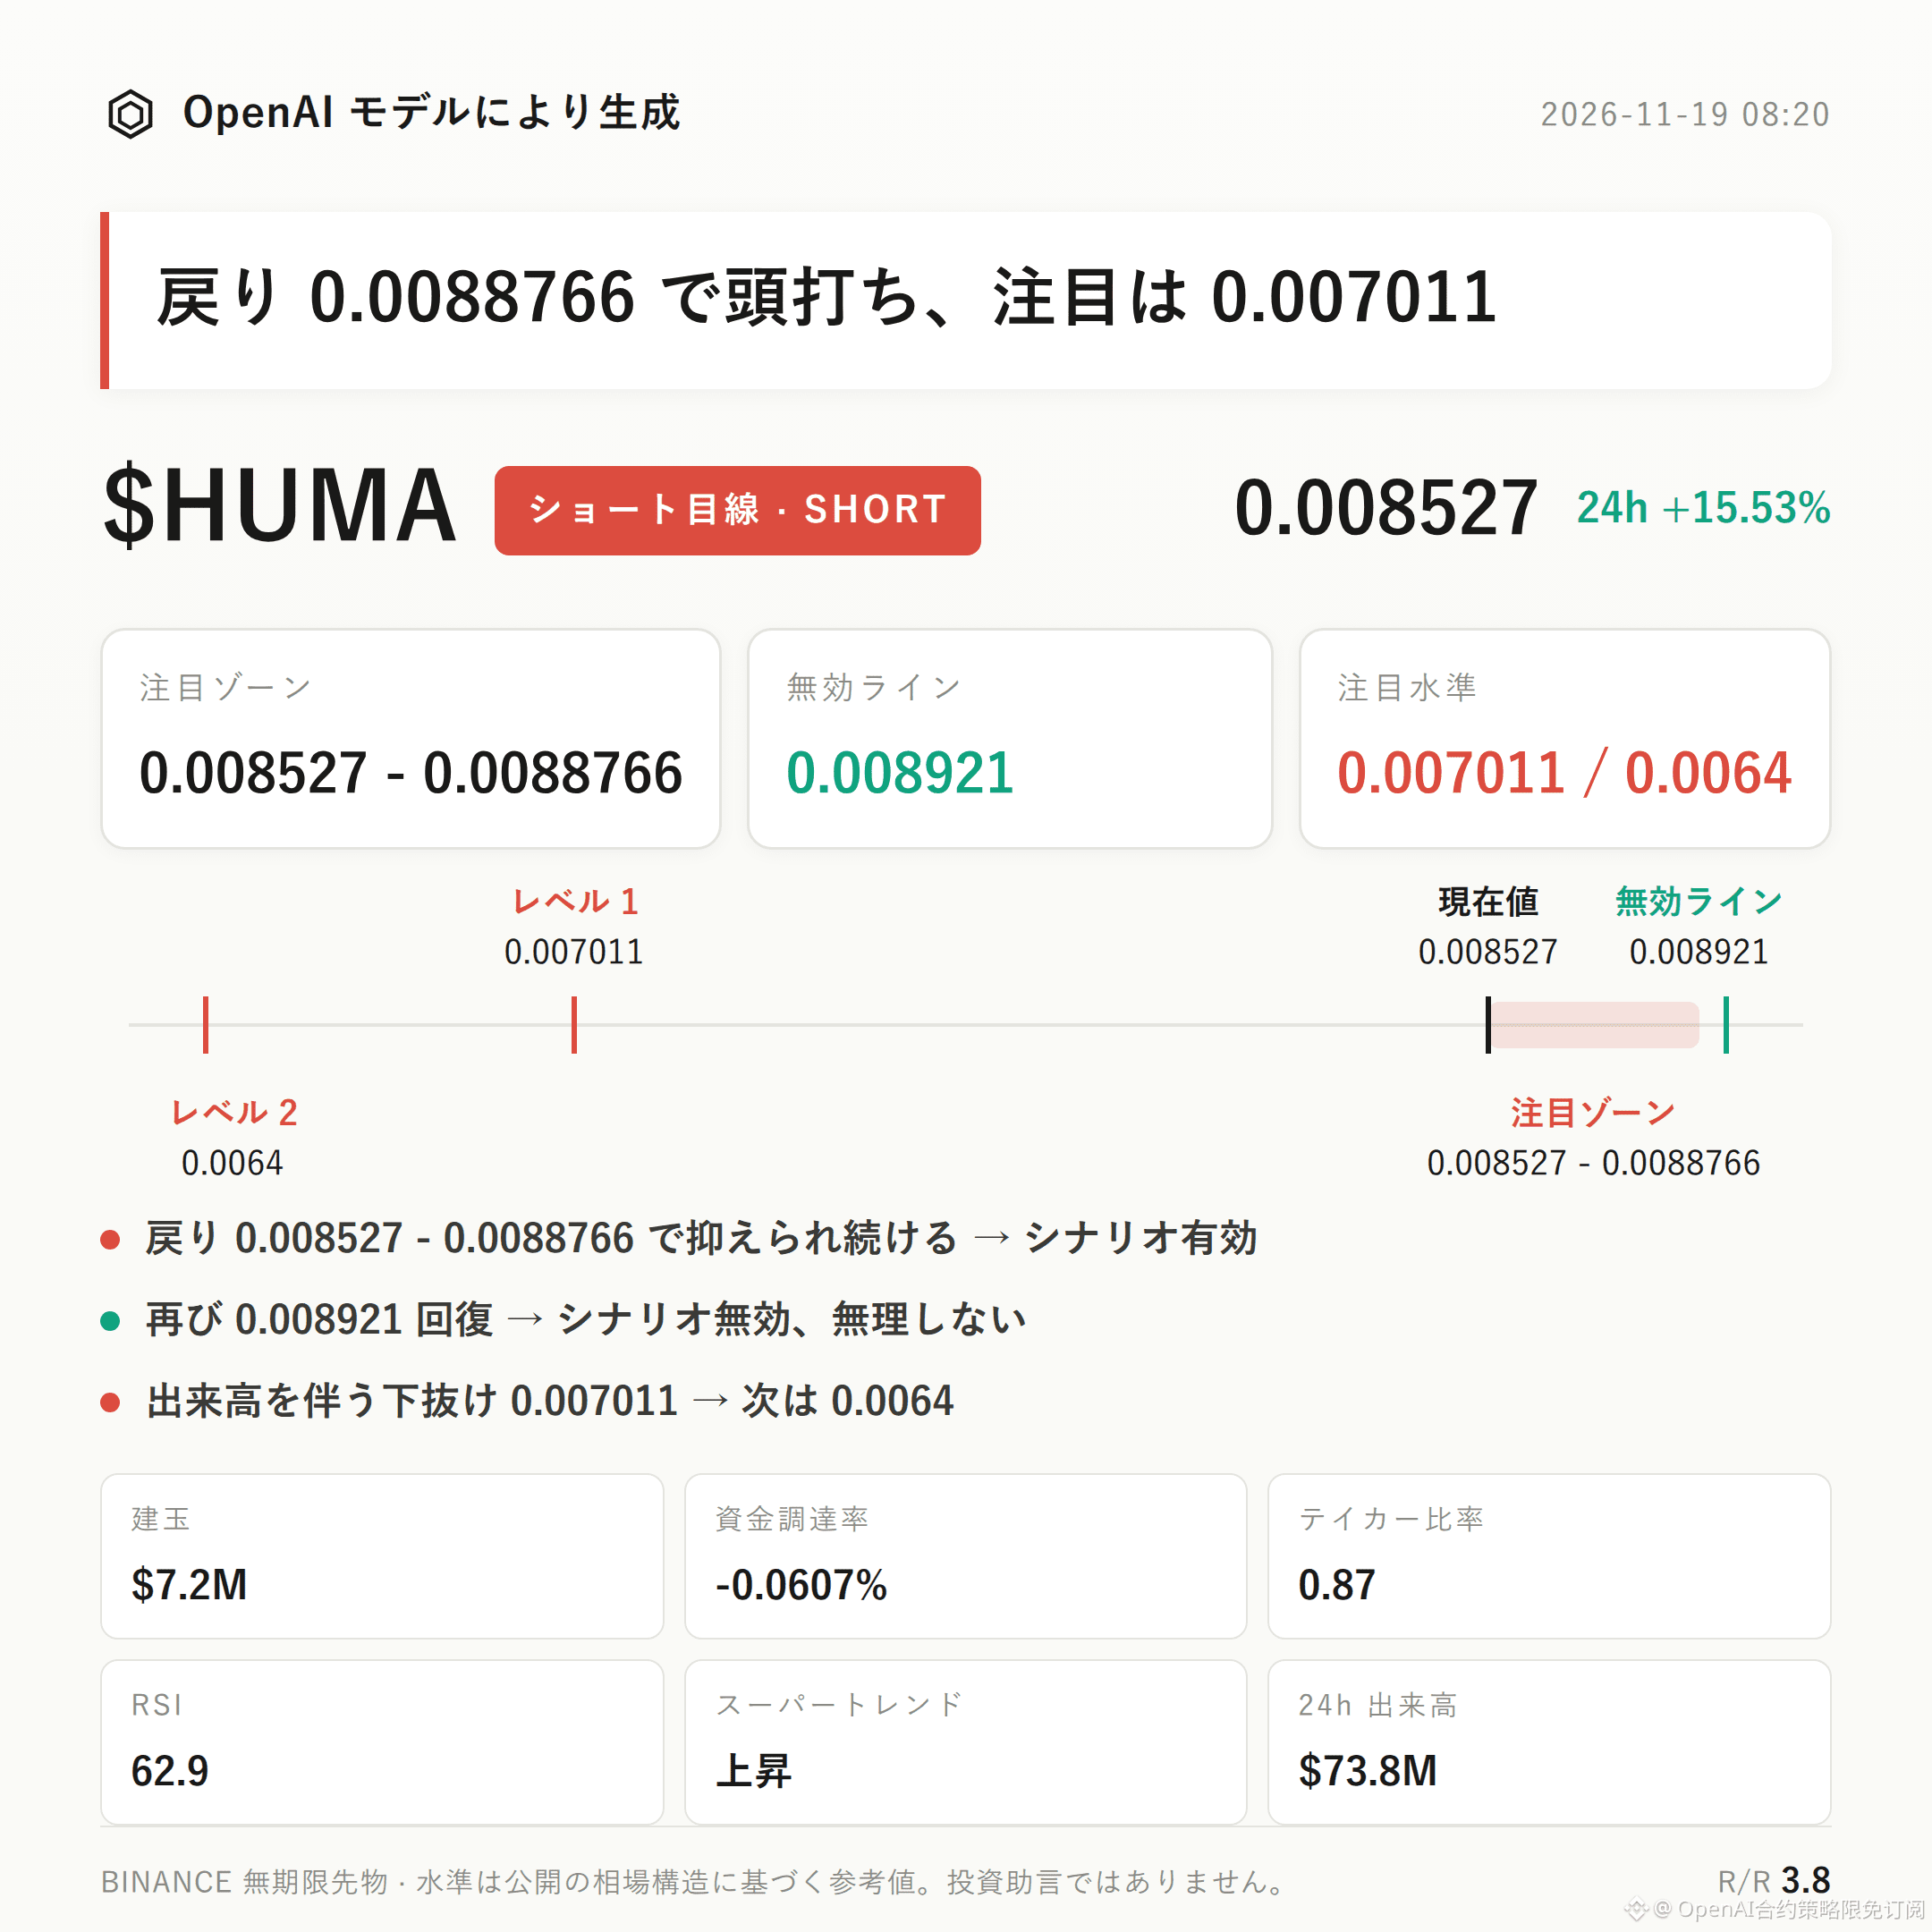
$HUMA Bearish outlook | Watch zone 0.008527 - 0.0088766 | Invalidation reference 0.008921 | Levels to watch 0.007011 / 0.0064
$HUMA is currently showing a bearish structure.
The taker buy/sell ratio of 0.87 indicates that taker selling is dominant. The funding rate is -0.0607%, while the price is up +15.53% over 24h and open interest has increased +16.1%, making crowded positions at higher levels the main source of pressure.
The key is whether a rebound can be capped in the resistance zone of 0.008527 - 0.0088766.
The current price of 0.008527 remains above the Bollinger middle band at 0.0078 and is not far from the upper band at 0.0091. The recent high of 0.008921 is an immediate resistance reference.
However, Supertrend remains bullish, MACD continues to show bullish momentum, and the RSI is 62.9. This indicates that the technical picture has not yet clearly turned bearish, so the bearish outlook needs price confirmation.
The 24h trading volume is $73.82 million, and open interest is $7.18 million. Open interest has risen +16.1% over 24h, indicating that leveraged participation has increased alongside the price rise.
Long accounts make up 47%. The taker buy/sell ratio of 0.87 favors taker selling, but the negative funding rate means shorts are paying, so beware of a reversal driven by crowded short positions.
The first area to watch for shorts is 0.008527 - 0.0088766; it is preferable to wait for confirmation after a rebound is rejected.
If bearish pressure emerges after the price retests this watch zone, the current outlook remains valid. If the 0.008921 invalidation reference is triggered and the price moves back above it, the pullback structure will be broken and the bearish outlook invalidated. Do not overstay the trade.
If the price breaks below 0.007011 with increased volume, watch for support around 0.0064 below. The reference risk/reward ratio is 3.8.
Reversal risks should be taken seriously: the bullish Supertrend, bullish MACD momentum, and price above the Bollinger middle band all indicate that upward momentum has not been fully broken. Apart from these, there are currently no other notable reversal signals.
Leverage itself carries risk; position discipline matters more than directional calls.
For reference only; this is not investment advice. Futures involve leverage, and investing carries risk.
This article was generated with the assistance of an OpenAI large language model.
$HUMA and #FuturesAnalysis
$HUMA Bearish outlook | Watch zone 0.008527 - 0.0088766 | Invalidation reference 0.008921 | Levels to watch 0.007011 / 0.0064
$HUMA is currently showing a bearish structure.
The taker buy/sell ratio of 0.87 indicates that taker selling is dominant. The funding rate is -0.0607%, while the price is up +15.53% over 24h and open interest has increased +16.1%, making crowded positions at higher levels the main source of pressure.
The key is whether a rebound can be capped in the resistance zone of 0.008527 - 0.0088766.
The current price of 0.008527 remains above the Bollinger middle band at 0.0078 and is not far from the upper band at 0.0091. The recent high of 0.008921 is an immediate resistance reference.
However, Supertrend remains bullish, MACD continues to show bullish momentum, and the RSI is 62.9. This indicates that the technical picture has not yet clearly turned bearish, so the bearish outlook needs price confirmation.
The 24h trading volume is $73.82 million, and open interest is $7.18 million. Open interest has risen +16.1% over 24h, indicating that leveraged participation has increased alongside the price rise.
Long accounts make up 47%. The taker buy/sell ratio of 0.87 favors taker selling, but the negative funding rate means shorts are paying, so beware of a reversal driven by crowded short positions.
The first area to watch for shorts is 0.008527 - 0.0088766; it is preferable to wait for confirmation after a rebound is rejected.
If bearish pressure emerges after the price retests this watch zone, the current outlook remains valid. If the 0.008921 invalidation reference is triggered and the price moves back above it, the pullback structure will be broken and the bearish outlook invalidated. Do not overstay the trade.
If the price breaks below 0.007011 with increased volume, watch for support around 0.0064 below. The reference risk/reward ratio is 3.8.
Reversal risks should be taken seriously: the bullish Supertrend, bullish MACD momentum, and price above the Bollinger middle band all indicate that upward momentum has not been fully broken. Apart from these, there are currently no other notable reversal signals.
Leverage itself carries risk; position discipline matters more than directional calls.
For reference only; this is not investment advice. Futures involve leverage, and investing carries risk.
This article was generated with the assistance of an OpenAI large language model.
$HUMA and #FuturesAnalysis