Data is more honest than any interpretation: first check whether trading volume and price changes are moving in sync.
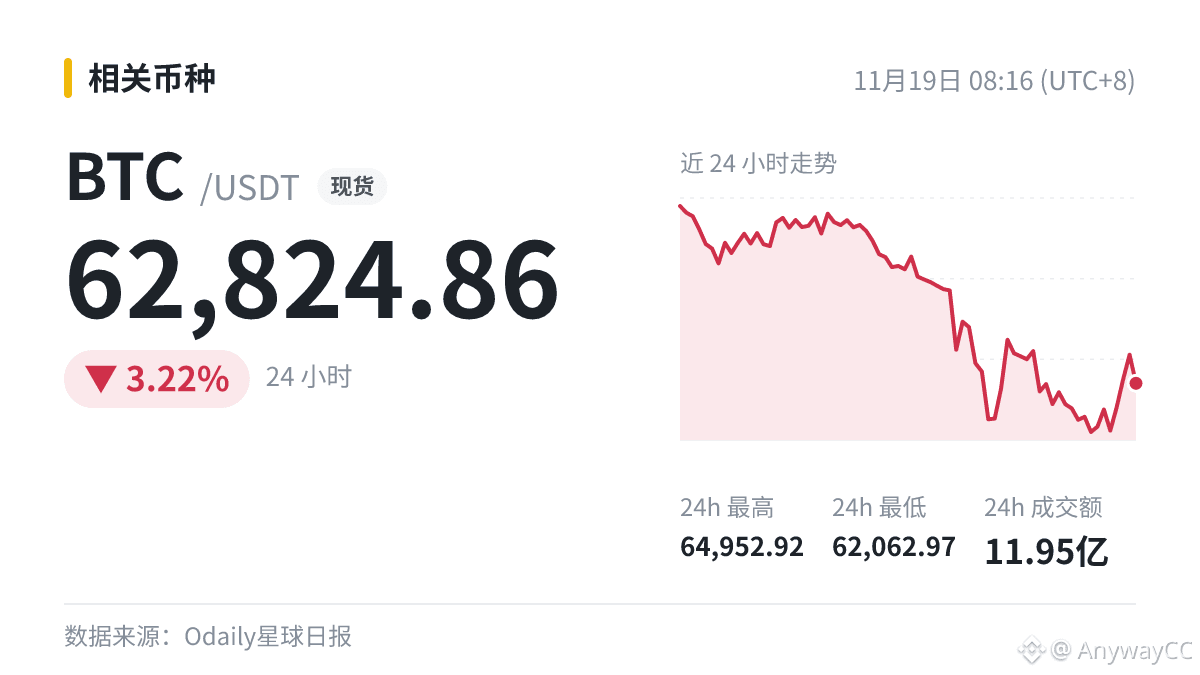
For example, this item: The Trump administration establishes a cybercrime threat center to crack down on cryptocurrency scams; $BTC intraday, down 3.22%, with trading volume of 1.195 billion.
Another bearish signal has appeared. Whether the direction has changed still depends on what the candlestick chart says.
For example, this item: The Trump administration establishes a cybercrime threat center to crack down on cryptocurrency scams; $BTC intraday, down 3.22%, with trading volume of 1.195 billion.
Another bearish signal has appeared. Whether the direction has changed still depends on what the candlestick chart says.