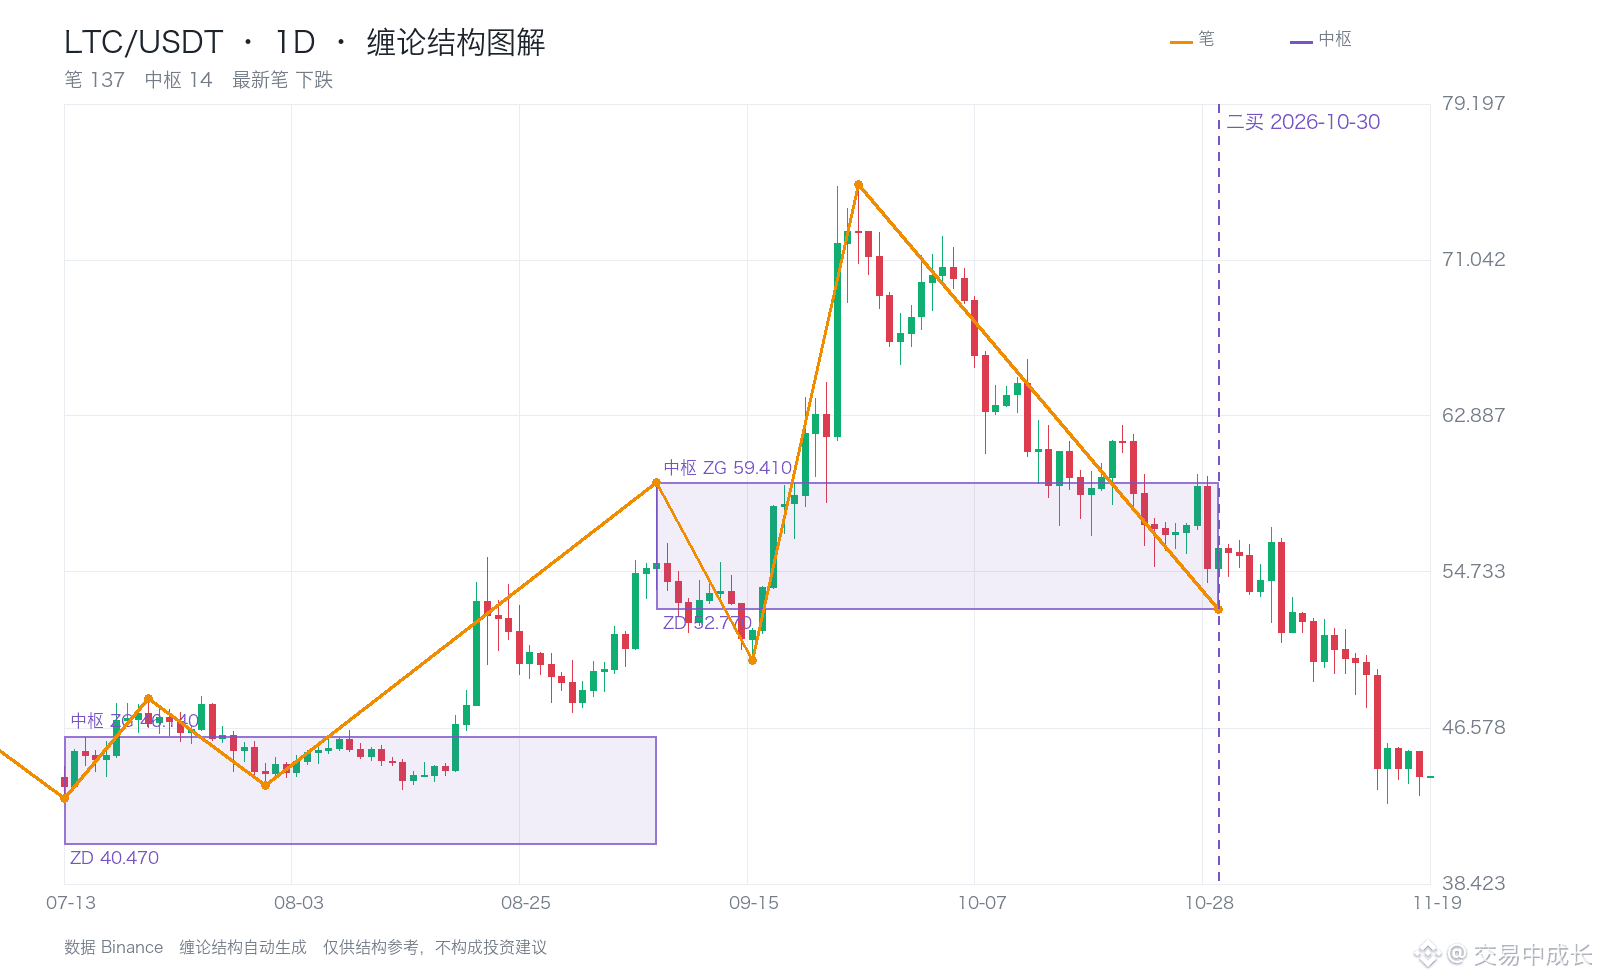
A look back at a historical case: On October 30, 2026, the engine identified the 1d structure for LTC as a second-buy signal.
The price marked for the preceding first-buy signal was 50.130, and the marked price of 52.770 was above that reference price.
Over the next 20 candlesticks, the price reached a high of 57.060, giving a maximum favorable excursion of 8.1% relative to the marked price. The closing price at the end of the window was 44.030.
When reviewing the case, also consider the adverse price movement along the way—not just how much ground the price eventually covered.
This is a retrospective structural review. The period’s high and low prices do not equal actual trading returns, nor do they mean the signal could have been confirmed at the time.
$LTC $BTC $ETH #缠论 #美联储加息 #Binance Feed
The price marked for the preceding first-buy signal was 50.130, and the marked price of 52.770 was above that reference price.
Over the next 20 candlesticks, the price reached a high of 57.060, giving a maximum favorable excursion of 8.1% relative to the marked price. The closing price at the end of the window was 44.030.
When reviewing the case, also consider the adverse price movement along the way—not just how much ground the price eventually covered.
This is a retrospective structural review. The period’s high and low prices do not equal actual trading returns, nor do they mean the signal could have been confirmed at the time.
$LTC $BTC $ETH #缠论 #美联储加息 #Binance Feed