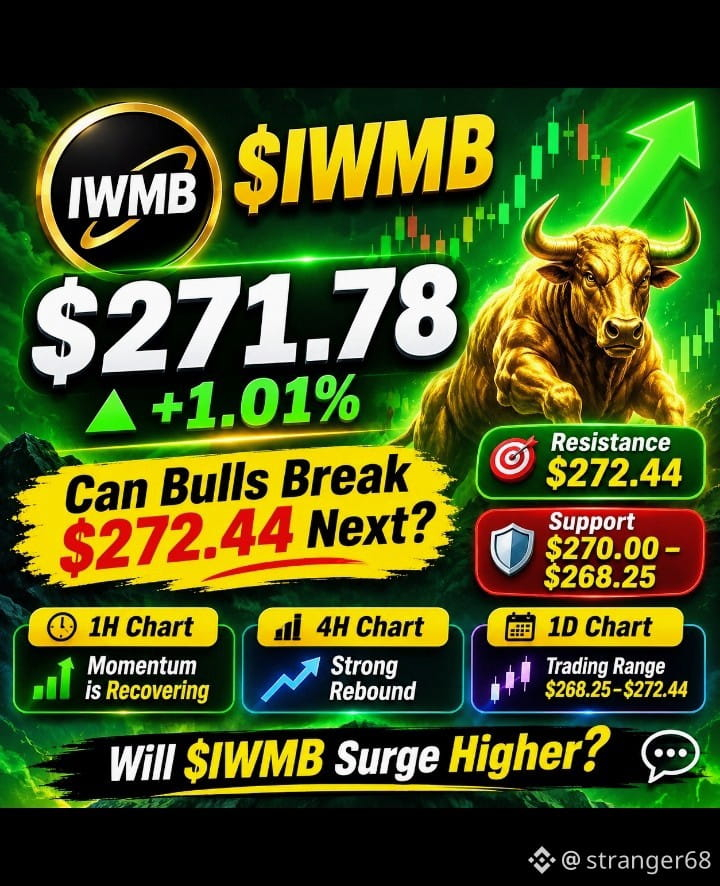
🚀 $IWMB Rebounds to $271.78 — Can Bulls Break $272.44 Next? 📈
💹 $IWMB is trading at $271.78, up 1.01%, after recovering from its 24H low of $268.25. Buyers have pushed the price close to the $272.44 high, putting immediate resistance back in focus. ⚡
⏱️ 1H Chart: Short-term momentum is recovering after a sharp dip toward $268.25. Price has climbed back above the MA(7) at $271.29, showing improving buying pressure. Holding above $271.00 could support another attempt toward $272.44. 📊
📈 4H Chart: The latest price action shows a strong rebound from the $268.25 area. However, $272.44 remains the key resistance to watch. A convincing breakout could open the door to further upside, while rejection may trigger another pullback. 🔍
🌍 1D Chart: The daily chart highlights a wide trading range between $268.25 and $272.44. More price history is needed to confirm a sustained daily trend, but holding above $270 would help maintain the recovery structure. 💪
🎯 Key Levels: Resistance: $272.44 | Support: $270.00–$268.25.
🔥 Can buyers push above $272.44 and extend the rally, or will resistance trigger another pullback? What’s your outlook? 💬
#IWMB #CryptoMarket #TechnicalAnalysis
#NvidiaBoardNotConsideringHuang’sReturnasCEO #LedgerHardwareImplantReportsExtendToDubai #MoreHikesExpectedIsBTCUnderPressure
💹 $IWMB is trading at $271.78, up 1.01%, after recovering from its 24H low of $268.25. Buyers have pushed the price close to the $272.44 high, putting immediate resistance back in focus. ⚡
⏱️ 1H Chart: Short-term momentum is recovering after a sharp dip toward $268.25. Price has climbed back above the MA(7) at $271.29, showing improving buying pressure. Holding above $271.00 could support another attempt toward $272.44. 📊
📈 4H Chart: The latest price action shows a strong rebound from the $268.25 area. However, $272.44 remains the key resistance to watch. A convincing breakout could open the door to further upside, while rejection may trigger another pullback. 🔍
🌍 1D Chart: The daily chart highlights a wide trading range between $268.25 and $272.44. More price history is needed to confirm a sustained daily trend, but holding above $270 would help maintain the recovery structure. 💪
🎯 Key Levels: Resistance: $272.44 | Support: $270.00–$268.25.
🔥 Can buyers push above $272.44 and extend the rally, or will resistance trigger another pullback? What’s your outlook? 💬
#IWMB #CryptoMarket #TechnicalAnalysis
#NvidiaBoardNotConsideringHuang’sReturnasCEO #LedgerHardwareImplantReportsExtendToDubai #MoreHikesExpectedIsBTCUnderPressure