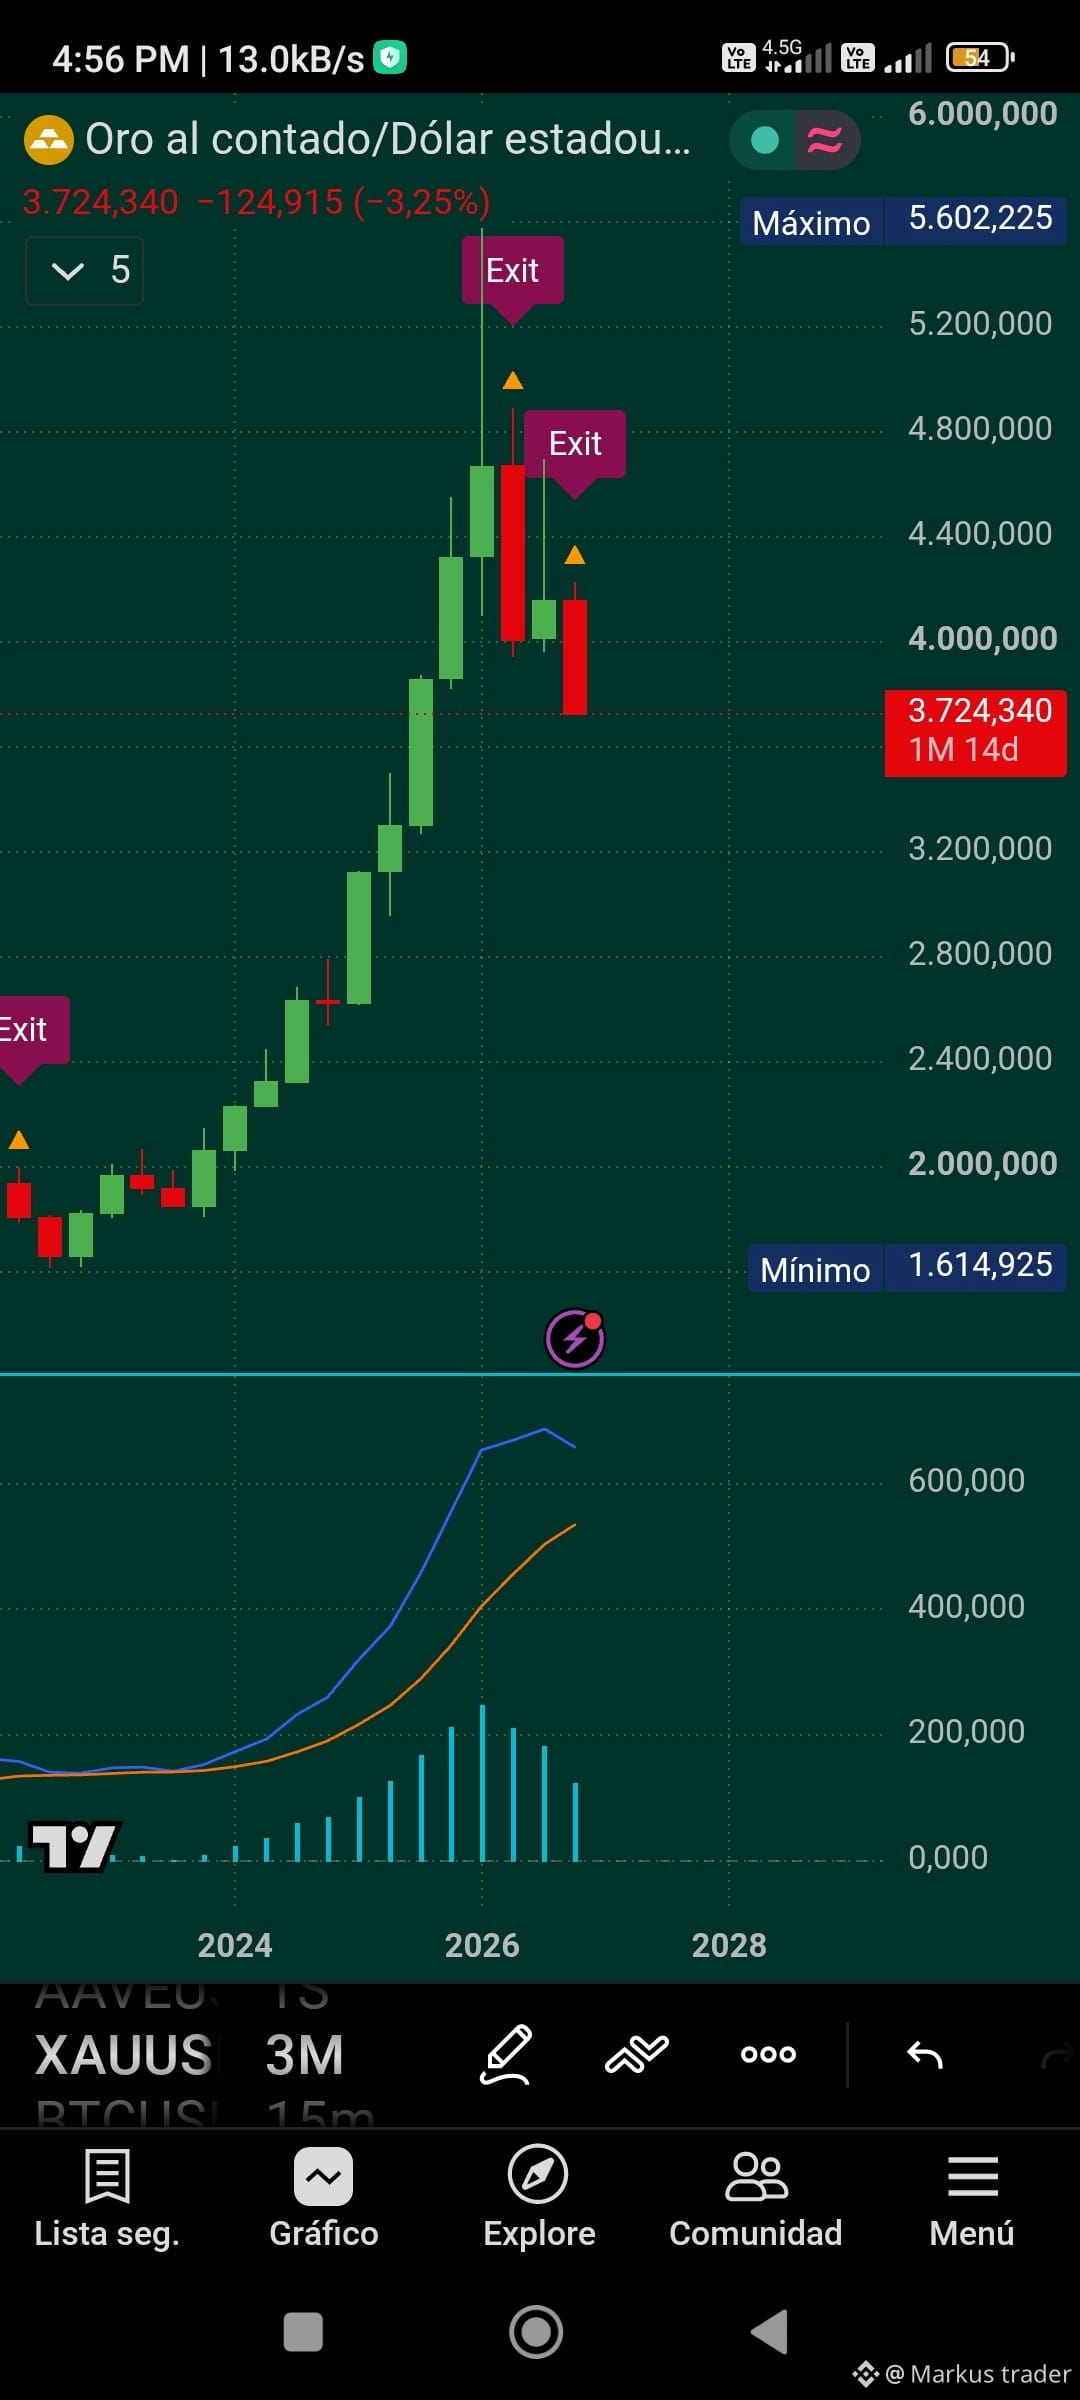
#xau This is the gold chart on the high timeframe of 3 months. If anyone is wondering whether it will keep falling or bounce back, here’s what I have to say about it. To understand that, it’s important to master timeframes.
🔴 6-month candles: bearish
🔴 3-month candles: bearish
🔴 1-month candles: bearish
So, if we know that the larger timeframes are bearish and dominate the smaller timeframes, D1 and H4, even if you see a bounce on H4, that doesn’t mean it’s a reversal. I hope you understand.
🔴 6-month candles: bearish
🔴 3-month candles: bearish
🔴 1-month candles: bearish
So, if we know that the larger timeframes are bearish and dominate the smaller timeframes, D1 and H4, even if you see a bounce on H4, that doesn’t mean it’s a reversal. I hope you understand.